Trace File Structure
When tracing is enabled for a database component, a tracing structure becomes available in the lower half of the component, for example:
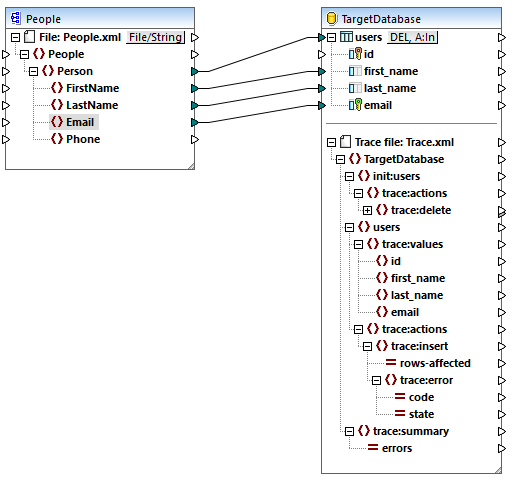
As illustrated above, the top node in the tracing structure indicates the name of the trace file that will be written when the mapping runs. The rest of the tracing structure is modeled after the structure of the database tables or stored procedures that take part in the mapping. In this example, the database name is "TargetDatabase", so a similar item exists in the trace structure.
The child item of "TargetDatabase" is users, which corresponds to the "users" database table. In this example, the database component has only one table, "users". However, in a component with many tables, the tracing structure includes each table present on the component. If you add or remove tables or stored procedures from the database component, then the tracing structure is updated accordingly. For instructions, see Adding, Editing, and Removing Database Objects.
In this example, an init:users structure also appears. This happens when you have configured the mapping to perform some initial action before the main insert, update, or some other action. For example, if you opted to delete all existing records from the table before inserting new ones, the init structure is present. It collects tracing information about the initial action (such as delete, or a custom SQL query) and any errors that may occur at this stage.
The trace:values structure displays all the columns of the database table (in this case, the columns of the "users" table). For stored procedures, this structure displays the parameters of the stored procedure. By default, all columns are set to be traced, but you can configure which columns should be traced, as described previously.
The trace:actions items indicate which actions are currently set to take place on the database table. In this example, a database update action ![]() is set to take place, so the trace:update item is available. If you change the component to perform a database insert action
is set to take place, so the trace:update item is available. If you change the component to perform a database insert action ![]() , then the trace structure would change to trace:insert, and so on for other action kinds. In case of stored procedures, a trace:execute action is visible instead.
, then the trace structure would change to trace:insert, and so on for other action kinds. In case of stored procedures, a trace:execute action is visible instead.
Each trace action has a rows-affected attribute that specifies how many rows were affected by the respective database action.
The trace:error item is populated only if a database error occurs during mapping execution. It has two attributes, code and state. The text of the error and the attribute values are supplied by the database driver and will therefore be different for each database kind.
The trace:summary item includes an errors attribute which reports the number of encountered errors. The attribute value is 0 if no errors were encountered.
Previewing trace files
When tracing is enabled for a target database component, the trace file is also included in the preview when you click the Output pane to preview the mapping result. This is useful if you want to see how the file will approximately look like. Note that the actual generated trace file will look different based on the mapping execution result.