Database Tracing and Error Logging
When a mapping writes data to a database, you can optionally enable database tracing and error logging. Tracing is useful if you want to track all the changes done by the mapping to the database when the mapping runs. When tracing is on, events such as database insert or update actions or errors are logged in an XML file that you can later analyze or perhaps process further in an automated way. If you prefer the log file to be in a format other than XML, you can optionally map data from it to some other component kind supported by MapForce (for example, a text file, or even another database).
| Note: | In order for a mapping to support tracing and error logging, the mapping language must be set to Built-in. Database logging and tracing is not supported in C#, C++, or Java. |
Database tracing is configurable, in that you can choose to trace all messages, only errors, or you can disable tracing completely. In addition, you can use tracing at the following levels:
•Database component level. At this level, you effectively switch tracing on or off for that database component. This is useful for mappings that have multiple target database components, and you need tracing only for some of them.
•Table or stored procedure level. On a database component, you can decide whether tracing should take place for each table or stored procedure. When enabled, tracing at this level includes events pertaining to table actions such as "Insert All", "Update If", "Ignore If", "Delete If". In case of stored procedures, events related to the stored procedure call are traced.
•Database field level. By default, all fields are traced, but you can exclude certain fields from being traced, or you can specify that they should be included in the trace file only on error.
Importantly, the three levels above are hierarchical and tracing settings are propagated from top to bottom. Therefore, if you disable tracing at database component level, it is not possible to enable it at table or stored procedure level. Likewise, if you disable tracing at table level, it is not possible to set it at database field (column) level. The same applies when you narrow down the tracing level. For example, if you limit tracing only to errors at database component level, then it is not possible to use full tracing at table or stored procedure level.
Tracing at database component level
To enable tracing at database component level:
1.Right-click the database component, and select Properties from the context menu (Alternatively, double-click the title bar of the database component). This opens the Database Component Settings dialog box.
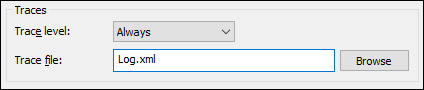
2.Select the desired trace level (Always, Errors, Disabled). Selecting Errors will create a trace file only if database errors occur when the mapping runs.
3.Next to Trace file, type the name or path of the XML file where all the tracing details will be written (for example, Log.xml). If you enter a file name instead of a full path, the trace file will be created in the same directory where the mapping runs.
After you enable tracing, the database component changes its structure on the mapping. Namely, it displays, in addition to the database structure, a new node hierarchy of items where the top item in the hierarchy is the trace file. For more information, see Trace File Structure.
Enabling tracing at database component level automatically enables it for all tables or stored procedures on that component to which a mapping connection exists. If necessary, you can further tweak tracing at the table or stored procedure level, as described below. Note that tables or stored procedures that are displayed on the component but do not take part in the mapping (that is, no mapping connections exist to them) will not be traced.
Tracing at table or stored procedure level
To enable tracing at table or stored procedure level:
1.Make sure that the tracing level at database component level is set to either Always or Error (see above).
2.Do one of the following:
oClick the table action button (for example, ![]() ) next to the table where you want to enable tracing, or
) next to the table where you want to enable tracing, or
oIf this is a stored procedure, click the Show Context Menu  button, and then select Procedure Settings from the context menu.
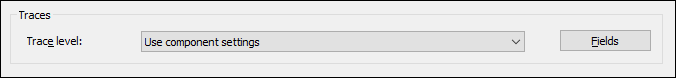
3.Select the trace level. The Use component settings option inherits the same settings that were defined at the component level. The Limit to errors option restricts tracing only to error events. Always disabled means that no tracing will occur for this table or stored procedure.
Tracing at database field level
When you enable tracing at database component level and table or stored procedure level, all the fields (database columns) are included in the tracing report by default. Optionally, you can restrict tracing only to specific database fields or stored procedure parameters. To do this, click the Fields button on the Database Table Actions or Database Procedure Settings dialog box, see above.
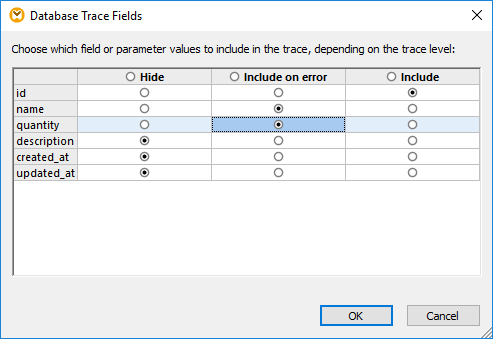
Selections made on this dialog box affect the trace file structure. For example, any fields that you opted to hide will no longer appear in the trace file. You might want to do this, for example, in order to reduce the log file size.
To hide or include multiple fields simultaneously, click the respective option in the header.