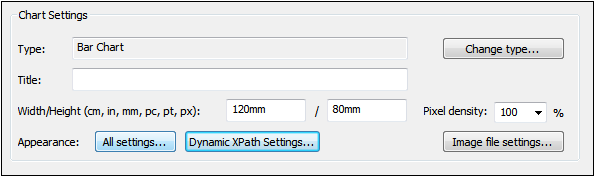
Basic Chart Settings
This section:
Setting the chart type
The most basic chart setting is the chart type. To select the chart type, click Change Type in the Chart Settings pane of the Chart Configuration dialog.
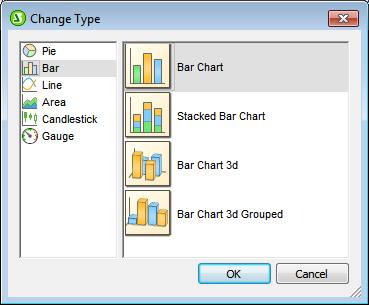
The various types of charts that are available are listed below. In the Change Type dialog (screenshot above), select the chart type you want and click OK.

In pie charts, one column/axis provides the values, another column/axis provides labels for these values. The labeling column/axis can take non-numeric values. 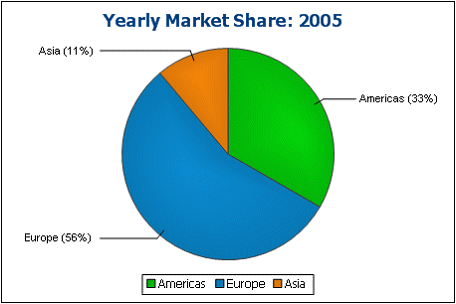
|
Bar charts can have two sets of values used along two axes (below). 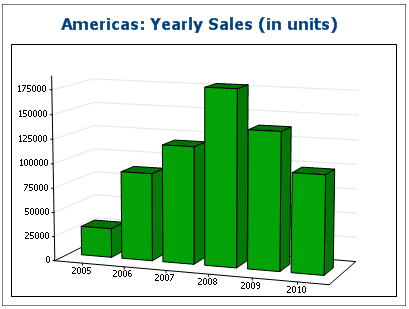 They can also use three sets of values, as in the example below: (i) continent, (ii) year, (iii) sales volume. Bar charts can be displayed in 2D (below) or 3D (above). 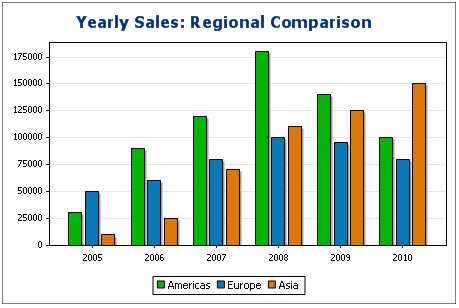 A three-axis bar chart can also be stacked if you need to show totals. Compare the stacked chart below with the chart above. The stacked chart shows the total of sales on all continents. 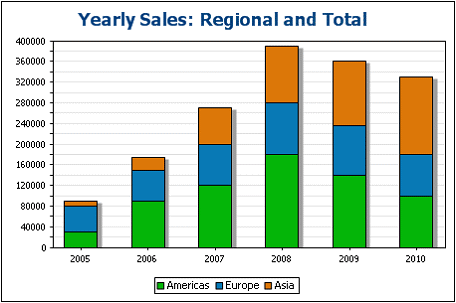
|
The difference between a line chart (below left) and a value line chart (below right) is that value line charts only take numerical values for the X-axis. If you need to display line charts with text values on the X-axis, use line charts. 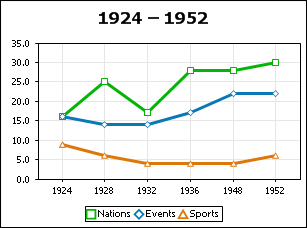 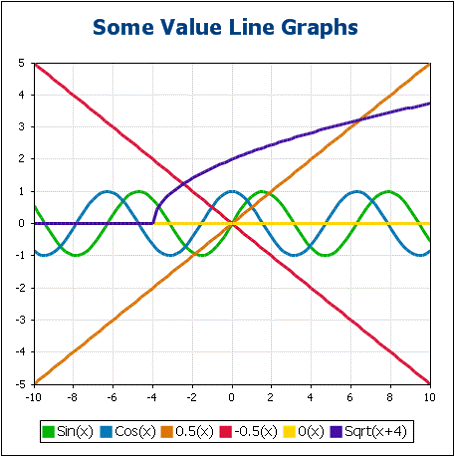
|
Area charts are a variation of line charts, in which the areas below the lines are also colored. Note that area charts can also be stacked (see bar graphs above). 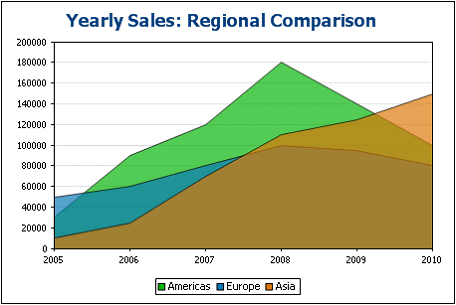
|
A candlestick chart can be used to depict price movements of securities, commodities, currencies, etc over a period of time. The chart indicates not only how prices developed over time, but also the daily close, high, low, and (optionally) open. The Y-axis takes three or four series (close, high, low, and (optionally) open). The screenshot below shows a four-series candlestick chart. 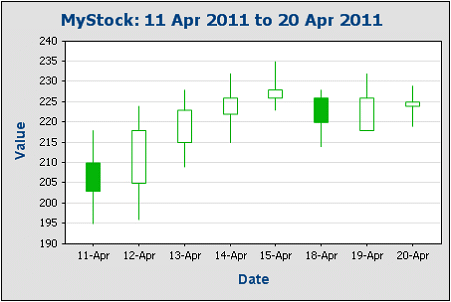
|
Gauge charts are used to illustrate a single value and show its relation to a minimum and a maximum value.
|

Other basic settings
In the Chart Settings pane, you can also set the title of the chart (see screenshot below).
Additionally:
•The chart's width and height can be entered as static values directly in the Chart Settings pane.
•The Pixel Density setting specifies the resolution of the chart image in the output. It is set as a percentage of the height and width setting. For example: If a chart is specified to have a height of 250px and a width of 250px, and the pixel density has been set to 200%, then a chart image file is created measuring 500px x 500px. In the output, this image file will be constrained to dimensions of 250px x 250px, thus producing an image of higher resolution.
•Click the Image File Settings button to specify the location and name of an image file for the chart. This image file is used when a preview is generated or when the Save Generated Files command is used. Image files created for previews are deleted when StyleVision is closed.