The Report Table
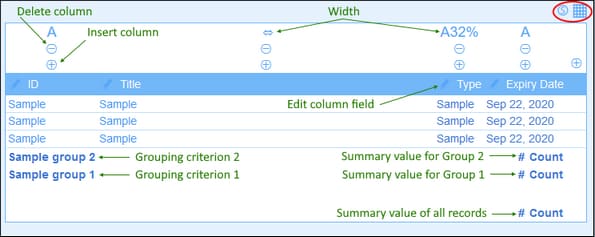
The report table is defined below the report properties. The report table will be displayed as the first part of the report. The columns of this table (see screenshot below) represent the data table fields and/or loose links that were selected for inclusion in the table. Table rows each hold a record of the data table. To edit the structure and content of the table, click the Table editing icon (circled in red in the screenshot below)
You can edit table structure and content as follows:
•Insert columns to the left of the selected column. To append a new column to the right of the rightmost column, click the Append Column icon (which is situated to the right of the rightmost column).
•To delete a column, click its Delete icon.
•To change the field or loose link represented in a column, click the column's Edit icon and select the new field or loose link.
•For each column, properties are available that depend on the column's datatype. For example, you can sort the records of the table according to the values of a specific column, or you could hide the label of individual columns.
•For columns of datatype child record or liked record, instead of displaying the records in a list, you can display an aggregate value for the child or linked records. For example, you can display: a sum of the values of all the child records, or an average of the values, or whether at least one record exists, or values of all the records run together, separated by a separator that you specify.
•Number columns can be formatted. There is one important property named Summary, which is described in the sub-section named Summary values immediately below.
•To set a column's display properties, click its Width icon. Column width options are: (i) Default column width, where all columns are equally sized; (ii) Fixed width as percent; (iii) Auto-size the column width based on content, with an optional maximum width. Auto-sized columns are indicated by an A. For columns with fixed widths as percent, and for auto-sized columns with a maximum percent width, the percent width is indicated in the column header. Column padding (left and right) is set with the respective sliders.
•F
•To exit the table editing mode, click the Table editing icon.
Summary values
It is sometimes useful to have a summary value at the bottom of a column. A summary value applies a calculation to the values of a column and shows the result. For example: the values of a column that is of a number datatype can be summed up, averaged, scanned for a minimum and/or maximum value; or the values of a column that is of a text datatype can be counted to display how many values are in that column. Summary values are shown: (i) for groups, and (ii) for all records (at the end of the report).
To set up the summary values of a column, click the column's Edit icon, and select the kind of summary value (listed below). The available options depend on the datatype of the respective field (defined in the field's Type property).
•Count: For all datatypes. Counts the number of values in the column.
•Sum: For the number datatype. Sums the values in the column or group.
•Average: For the number datatype. Averages the values in the column or group.
•Minimum: For the number and string datatype. Scans the values in the column or group for the minimum value. For the string datatype, the minimum value is based on the alphabetical order.
•Maximum: For the number and string datatype. Scans the values in the column or group for the maximum value. For the string datatype, the maximum value is based on the alphabetical order.
| Note: | Summary values can be defined for any and all columns. You can set up more than one summary value for a column if multiple summary values are possible. For example, in the case of a column with numbers, you could show the sum of all values, or the average. |
Styles in the report table
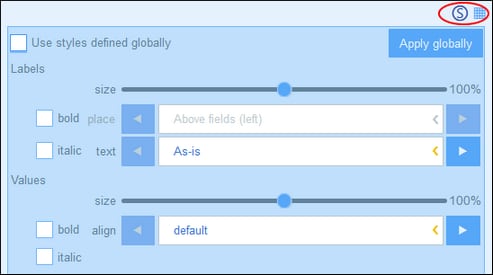
To set styles for the table, click its Styles icon (inside the red ellipse in the screenshot above). The Styles form for the table looks something like in the screenshot below.
Note the following points:
•A label is the column header. Values are the values of the fields of records. You can set text properties for the label and the value separately, including the text placement.
•If you select the Use global styles check box at the top of the table, then the global styles specified in the app's settings will be used.
•The Apply Globally button applies the current styles to the global setting for all forms. All forms that do not have their own table styles will receive the current styles.
•To exit the styles editing mode, click the Styles icon.
| Note: | After you have finished making structure and style changes to the table, click Save Form and then Save Changes. |
| Note: | If one or more charts have been created, you can choose to show only charts in the report (and hide the table). See the Charts topic for information about this. |

