Series
The Series Axis represents the value of selected data points. For example, you could select the Total Assets concept as one series of data points. In that case, the value of Total Assets facts will be output for every corresponding Category Axis selection (such as accounting dates).
Charts with single series
This kind of chart (with a single series selected as described above) is shown in the screenshot of the bar chart below.
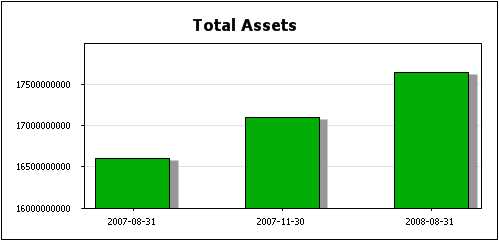
This chart selects a single series, the Total Assets concept, and represents its value for the corresponding Category Axis dates. The bar chart can easily be changed into other chart types, such as a line chart or a pie chart (screenshots below), by changing the chart type in the Chart Settings dialog.
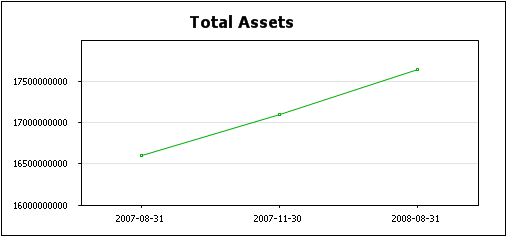
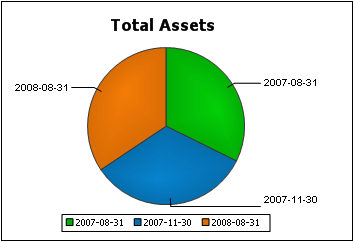
The points on the line chart are the values of the Total Assets concepts for the corresponding Category Axis dates. The pie chart shows the values of the Total Asset concepts for each Category Axis date as a segment of the pie.
Charts with multiple series
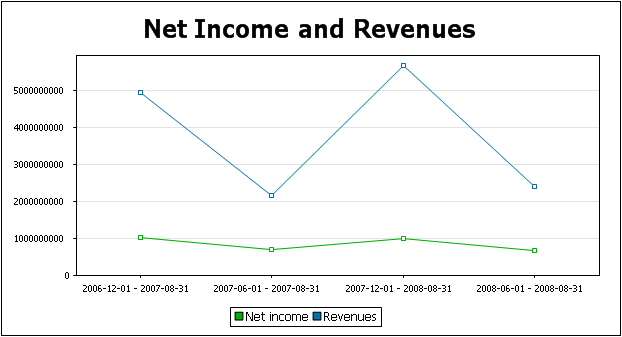
In the single series example given above, charts were created for one series: the Total Assets concept. But a chart could have more than one series. In the example below, two series are specified: for the Net Income and Revenues concepts. Both series are shown for four duration periods on the Category Axis.
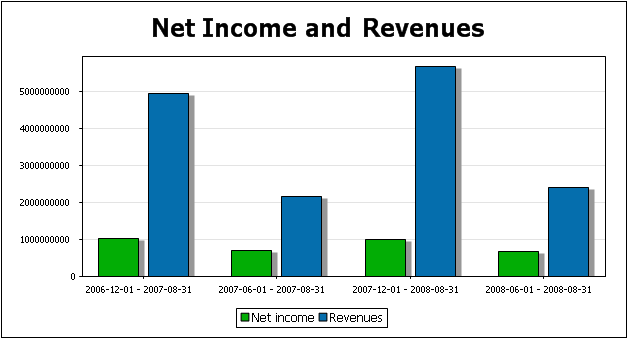
The bar chart above can be converted to other kinds of chart that can represent multiple series, such as line graph charts (screenshot below). But multiple series cannot be represented in charts such as pie charts—which are limited to one series.
Selecting the series
To select items for the Series Axis, first drag a component from the Available pane into the Series pane. (In the screenshot below, the Concepts component has been dragged to the Series pane.) Then click the Ellipsis icon  of each component to set the component's properties.
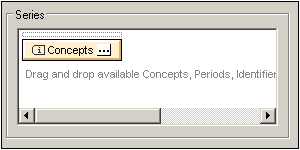
In the case of the Concepts component, the Concept Properties dialog enables you to select the concepts to display. Each selected concept in this dialog will become a series of the chart.
For details of the properties of the various components, see the section Component Properties.