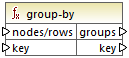
group-by
The group-by function creates groups of records according to some grouping key that you specify.
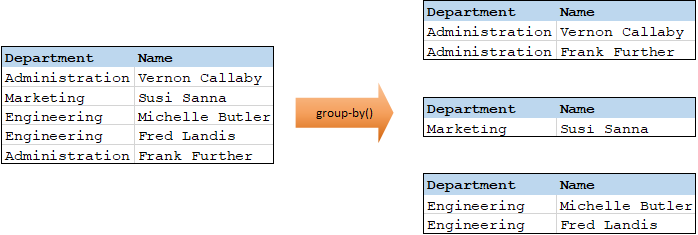
For example, in the abstract transformation illustrated below, the grouping key is "Department". Since there are three unique departments in total, applying the group-by function would create three groups:
Languages
Built-in, C++, C#, Java, XSLT 2.0, XSLT 3.0.
Parameters
Name | Description |
|---|---|
nodes/rows | This input must receive a connection from a mapping item that provides a sequence of zero or more values. For example, the connection may originate from a source XML item. |
key | The key by which to group items. |
Example 1
Let's assume that your source data is an XML file with the following content (note that, in the code listing below, the namespace and XML declarations were removed for simplicity).
<company> |
The business requirement is to group person records by department. To achieve this, the following mapping invokes the group-by function, and supplies department as key.
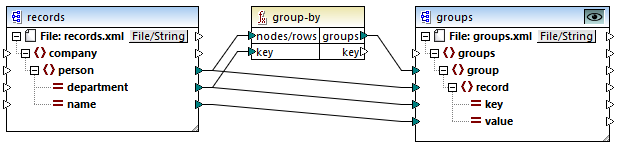
The mapping result is as follows:
<groups> |
This example, together with other grouping examples, is part of the following mapping file: <Documents>\Altova\MapForce2026\MapForceExamples\Tutorial\GroupingFunctions.mfd. Remember to click the Preview  button applicable to the function you want to preview, before clicking the Output pane.
Example 2
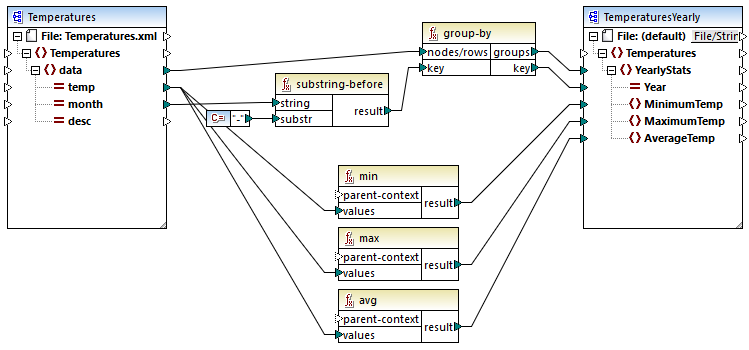
This example shows you how to group records with the help of the group-by function, and also illustrates how to aggregate data. This example is accompanied by a demo mapping available at the following path: <Documents>\Altova\MapForce2026\MapForceExamples\GroupTemperaturesByYear.mfd. This mapping reads data from an XML file that contains a log of monthly temperatures, as illustrated in the code listing below:
<Temperatures> |
The business requirement of this mapping is two-fold:
1.Group temperatures of each year together.
2.Find out the minimum, maximum, and the average temperature of each year.
To achieve the first goal, we use the group-by function. To achieve the second goal, we use the min, max, and avg aggregation functions.
GroupTemperaturesByYear.mfd
The way MapForce executes a mapping (and the recommended approach to start reading one) is by looking at the topmost item of the target component. In this example, an YearlyStats item will be created for each group returned by the group-by function. The group-by function takes as first argument all data items from the source and groups them by whatever is connected to the key input. Since the requirement is to group temperatures by year, the year must be obtained first. To achieve this, the substring-before function extracts the year part from the month attribute of each data element. Namely, it takes as argument the value of month and returns the part before the first occurrence of substr. As illustrated above, in this example, substr is set to the dash character; therefore, if given the value "2006-01", the function will return "2006".
Finally, the values of MinimumTemp, MaximumTemp, and AverageTemp are obtained by connecting these items with the respective aggregate functions: min, max, and avg. All three functions take as input the sequence of temperatures read from the source component. These functions do not need a parent-context argument, because they already work in the context of each group. In other words, there is a parent connection—from data to YearlyStats— which provides the context for each aggregation function to work on.
To preview the mapping output, click the Output pane. Notice that the number of groups coincides with the number of years obtained by reading the source file, for example:
<Temperatures> |
Note: For simplicity, the code listings above contain less data than the actual input and output used by the demo mapping.