Categories
It is in the Categories pane of the Chart Wizard that the items displayed on the Category Axis are selected. (By default, the Category Axis is the X-Axis; the Y-Axis can be specified in the Advanced Chart Settings if you like. In pie charts, the Category Axis specifies which items are to form the segments of the chart.)
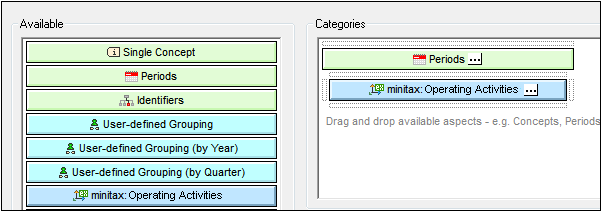
To select items for the Category Axis, first drag one or more components from the Available pane into the Categories pane. (In the screenshot below, the Period component and the explicit dimension for Statement have been dragged to the Categories pane.) Then click the Ellipsis icon ![]() of each component, to set its component's properties.
of each component, to set its component's properties.
Properties of components
A component's properties include settings to set a filter on what is selected, to specify how labels are displayed on the Category Axis, and how to sort the selected Axis items. The section Component Properties contains a complete list of these properties.
User-defined groupings
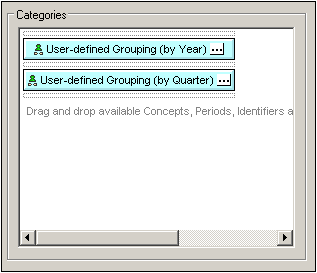
Among the components in the Available tab, are predefined groupings for years and quarters (see screenshot above). These enable you to set up, for example, a category for individual quarters, as shown in the screenshot below.
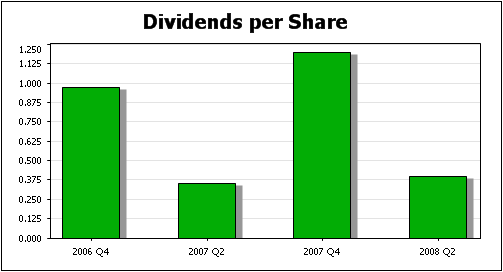
The output of the category selection shown above would be something like that shown in the screenshot below: the category selection (shown on the X-Axis) are the years and quarters found in the XBRL instance document.