XBRL Chart Wizard
The XBRL Chart Wizard is accessed when a concept is dragged from the source tree and dropped into the design. From the context menu that pops up select Create XBRL Chart. The wizard helps you to quickly and easily create chart representation of selected data. The window of the XBRL Chart Wizard consists of four panes:
1.A Chart Settings pane, in which the basic configuration of the chart is specified, for example, the chart's title, height, width, color scheme, label sizes, etc. Chart settings are described in detail in the Charts section of the documentation.
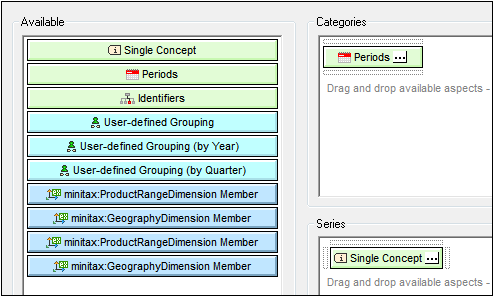
2.An Available pane (see screenshot below) containing schema tree items that can be created as the categories and series of the chart;
3.A Categories pane, in which the X-Axis items of the chart can be specified. For example, the X-Axis of an annual sales chart could have items corresponding to the years of the period under consideration. To remove empty categories from the output, check the Remove Empty Categories check box at the bottom of the dialog.
4.A Series pane for selecting what concepts are to be plotted. For example, in an annual sales chart, if the series members were the revenue and net income concepts, then the facts of these two series members could be plotted for multiple periods. As a result, for each year on the X-Axis, the revenue and net income values would be represented on the Y-Axis (say as bars or as points on line graphs). To remove empty series from the output, check the Remove Empty Series check box at the bottom of the dialog.
This section of the documentation is organized into two parts:
•Categories describes how data for the Categories (X-Axis) is specified.
•Series explains how members of the series are selected.
•Component Properties describes the property-set of each components.
After specifying the settings and data for the chart, click the OK button to insert the chart in the design. If you wish to change any of the chart settings or data selections after the chart has been inserted in the design, right-click the chart and select Edit Chart Settings.
Example files
Examples of XBRL charts can be found in the Charts and XBRL folders in the Example project in the Project Window.