Example: Line Charts
In this section, we discuss the line graphs (or category line graphs) contained in the SPS file YearlySales.sps. The SPS design is based on the XML Schema YearlySales.xsd and it uses YearlySales.xml (screenshot below) as its Working XML File. All three files are located in the (My) Documents folder, C:\Documents and Settings\<username>\My Documents\Altova\StyleVision2026\StyleVisionExamples/Tutorial/Charts.

<?xml version="1.0" encoding="UTF-8"?> <Data xmlns:xsi="http://www.w3.org/2001/XMLSchema-instance" xsi:noNamespaceSchemaLocation="YearlySales.xsd"> <ChartType>Pie Chart 2D</ChartType> <Region id="Americas"> <Year id="2005">30000</Year> <Year id="2006">90000</Year> <Year id="2007">120000</Year> <Year id="2008">180000</Year> <Year id="2009">140000</Year> <Year id="2010">100000</Year> </Region> <Region id="Europe"> <Year id="2005">50000</Year> <Year id="2006">60000</Year> <Year id="2007">80000</Year> <Year id="2008">100000</Year> <Year id="2009">95000</Year> <Year id="2010">80000</Year> </Region> <Region id="Asia"> <Year id="2005">10000</Year> <Year id="2006">25000</Year> <Year id="2007">70000</Year> <Year id="2008">110000</Year> <Year id="2009">125000</Year> <Year id="2010">150000</Year> </Region> </Data> |
After opening the SPS file in StyleVision, switch to Authentic Preview, and, in the Chart Type combo box (screenshot below), select Line Charts to see the line charts.

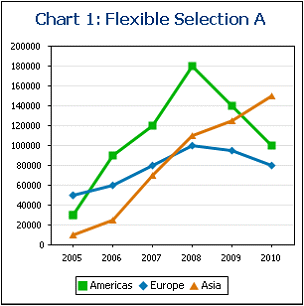
The line graph charts show the yearly sales of each region (see screenshot below). The X-Axis of the chart shows the years, the Y-Axis shows the units sold. Each line graph shows the sales of a region over the period 2005 to 2010. The legend key at the bottom indicates which line represents which region.
This chart was created within the Data node, which is the parent of the Region nodes (refer to XML file above). The data selection is as shown in the screenshot below.
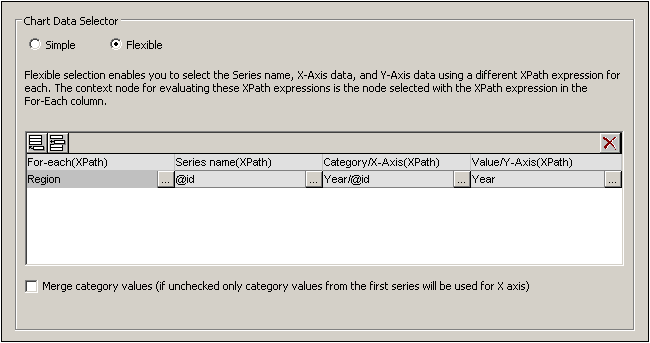
Note the following points about this data selection:
•The Z-Axis (Series Axis) selects the name of the region (Region/@id).
•The X-Axis selects the names of the years (Region/Year/@id) and the Y-Axis selects the sales for each year (content of the Region/Year element).
What the data selection above does is this: For each Region element, it selects a series name (the value of the Region element's id attribute), then generates the X-Axis for the Region (using the sequence obtained with the values of the Year/@id attributes). It then generates the Y-Axis values (using the sequence obtained with the content of the Year elements). This is done for all three Region elements, in sequence, generating the line graphs shown above.
For more information about data selection for the various axes, see the section Rules for Chart Data Selection.