Example: Candlestick Charts
Candlestick charts (screenshot below) are most commonly used to show the movement of stock prices. They provide at-a-glance information about the opening and closing prices, and the highest and lowest prices during a trading day.
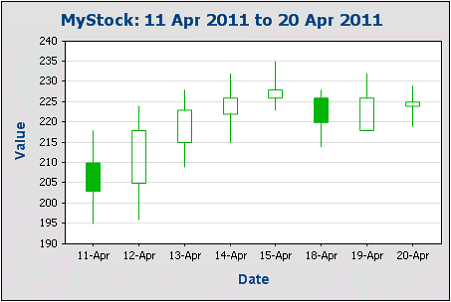
The screenshot above, for example, shows candlesticks of the share prices of a fictitious company, MyStock, for the trading days from 11 April 2011 to 20 April 2011. The highest and lowest points of the vertical line in each candlestick indicates the day's highest and lowest trading prices, respectively (see table below for prices). A color-filled candlestick body indicates a drop in the price over the day's trading, from the opening price to the closing price, an unfilled body indicates a price rise. So, on 11 April, we see that the price dropped from 210 to 203, whereas on 12 April the price rose from 205 to 218.
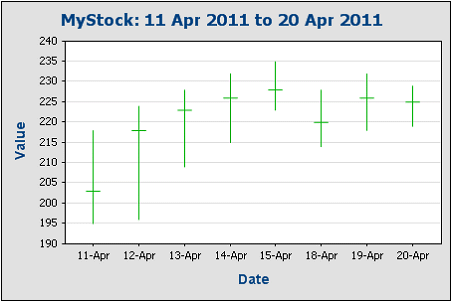
A second type of candlestick chart (screenshot below) shows three values: (i) the highest price traded on the day, (ii) the lowest price, and (iii) the closing price (indicated by the short horizontal line).
Candlestick chart example files
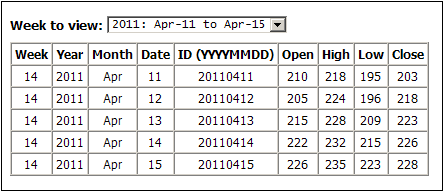
Files for the candlestick chart example discussed in this section are located in the (My) Documents folder, C:\Documents and Settings\<username>\My Documents\Altova\StyleVision2026\StyleVisionExamples/Tutorial/Charts. The SPS file Candlestick.sps (see screenshot below) uses Candlestick.xsd and Candlestick.xml. In Authentic View (screenshot below), the user can select what should be displayed in the candlestick chart. The selection options are: (i) the company (from two companies); (ii) the period for which prices are to be displayed; (iii) the extent of the Y-Axis; and (iv) the interval of Y-Axis ticks. Furthermore, the table below the chart allows new trading data to be entered for the two companies (right-click in a row and append or insert a Day element).

Notice that the top part of the design contains combo boxes and input fields in which the Authentic user can specify the parameters of the chart that is displayed below. These input specifications are stored within the XML file and are used to calculate some key chart settings.
XML file
The allowed structure of the XML document is as shown in the listing below. The document element Trades contains one Selection element and an unlimited number of Stock elements. Each Stock element can contain an unlimited number of Day elements.
<Trades xmlns:xsi="http://www.w3.org/2001/XMLSchema-instance"
xsi:noNamespaceSchemaLocation="Candlestick.xsd">
<Selection>
<Stock>Nanonull</Stock>
<StartDate>20110103</StartDate>
<EndDate>20110112</EndDate>
<YAxisStart>80</YAxisStart>
<YAxisEnd>180</YAxisEnd>
<YAxisTickInterval>20</YAxisTickInterval>
<WeekToView>25</WeekToView>
</Selection>
<Stock name="MyStock">
<Day id="20110103" year="2011" month="Jan" week="01" date="03">
<Open>90</Open>
<High>110</High>
<Low>88</Low>
<Close>105</Close>
</Day>
<Day id="20110104" year="2011" month="Jan" week="01" date="04">
<Open>100</Open>
<High>112</High>
<Low>92</Low>
<Close>109</Close>
</Day>
...
</Stock>
<Stock/>
...
<Stock/>
</Trades>
The Selection element contains information supplied by the Authentic user and this information is used to select what data is displayed in the chart. The data selection for the chart is therefore based on information in the Selection element. The exact details are explained in the next section. The data about the price movements of each stock on a given day is contained in the Stock/Day element of that stock on that given day.
Data selection for the candlestick chart
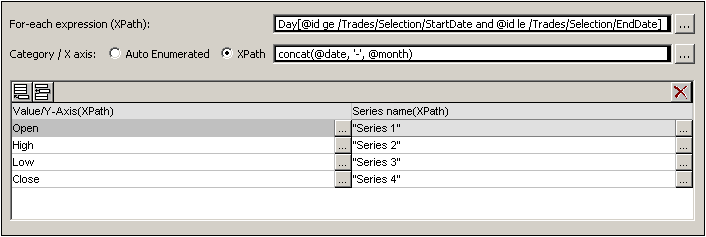
The data selection for the chart is specified in the Chart Configuration dialog (see screenshot below), which is accessed by right-clicking the chart and selecting Edit Chart Settings. The data selection was done using the Simple method.
The settings are made as follows:
•In the design, the chart is inserted within a Stock element. This Stock element has a filter to select the Stock element with an @id attribute equal to the content of the Selection/Stock element. So the context node within which the chart is created is the Stock element that the Authentic user selects in the Stock combo box.
•The For-Each XPath expression selects all Day elements that have an @id attribute which is greater than or equal to the StartDate that the Authentic user specifies and is less than or equal to the user's EndDate. This ensures that data for the dates selected by the Authentic user will now be processed. The context node for all the other XPath expressions used for data selection in this dialog will therefore be the Day element (see example structure below).
<Day id="20110104" year="2011" month="Jan" week="01" date="04">
<Open>100</Open>
<High>112</High>
<Low>92</Low>
<Close>109</Close>
</Day>
•On the X-Axis of the chart, we wish to show the dates. So we use the XPath expression: concat(@date, '-' @month). This expression serves to collect the date from the attributes of the respective Day elements.
•The Y-Axis plots the stock prices. We use four series for our candlestick chart: (i) the opening prices, (ii) the highest price of the day, (iii) the lowest price of the day, and (iv) the closing price. For each of these series, we identify, respectively, the Day/Open, Day/High, Day/Low, and Day/Close elements.
Important: The order in which the series are specified is important, and must be as follows:
•Four-series charts: (i) Open, (ii) High, (iii) Low, (iv) Close.
•Three-series charts: (i) High, (ii) Low, (iii) Close.
The nodes that contain the values that will be used for the various series may have any valid XML name (they need not be called Open, High, etc) but these nodes must contain number values.
Other settings in the example file
Some other crucial chart settings were obtained as explained below. Many were obtained dynamically from the XML file and needed to be set using Dynamic XPath settings.
•Since the name of the chart needs the Authentic user's date specifications, the chart title is set dynamically.
•The Y-Axis range and interval is also determined by the user and therefore requires dynamic XPath settings.
