Debugger
The Debugger enables you to debug an XPath expression in the context of a Working XML File. To access the Debugger, selecting Start Debugging in the Start Evaluation/Debugging dropdown menu (screenshot below). This sets the mode to Debug Mode. You can then switch between the Builder (for help with building the expression) and Evaluator (for debugging the expression). To start debugging, click Start Evaluation/Debugging (F5)
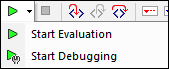
After you have entered an expression, you can start debugging by clicking Start Evaluation/Debugging (F5) (after making sure that you are in Debug Mode).

|

Layout of Debug Mode
In Debug Mode, two additional panes are added to the Results pane (see screenshot below):
•the Call Stack and Debug Points pane, each of which has a separate tab in the pane
•the Variables and Watch Expressions pane; both watch expressions and variables are shown in the same pane.

Debugger Mode offers the following features:
•Enables you to step into the XPath evaluation process, one step at a time to see how the XPath expression is being evaluated. Use the Step Into (F11) toolbar button for this. At each evaluation step, the part of the expression being currently evaluated is highlighted in yellow (see screenshot above), while the result of evaluating that step is shown in the Results pane. For example, in the screenshot above, all the section descendant elements of the book element have been selected.
•Set breakpoints where you want to pause the evaluation and check results at these points. You can step through the evaluation by pausing only at breakpoints. Use the Start Debugging (F5) toolbar button for this. This is quicker than pausing at every step with Step Into (F11).
•Set tracepoints to see a report of results at the steps marked as tracepoints. The evaluation will not pause (except at breakpoints), but the tracepoint results will be displayed in a list in the Results pane.
•Watch expressions can be used to check information (such as document data or aspects of the evaluation). This is especially useful at breakpoints.
•Variables that are in scope, including their values, are displayed in the Variables and Watch Expressions pane.
•Processor calls of an evaluation step are shown in the Call Stack tab of the Call Stack and Debug Points pane.
•If breakpoints and tracepoints have been set, then these are displayed in the Debug Points tab of the Call Stack and Debug Points pane.
For more information about these features, see their descriptions below.
Running the Debugger
The broad steps for debugging an XPath expression are as follows:
1.Enter the XPath expression in the expression pane.
2.Set any breakpoints or tracepoints you want. A breakpoint is a point at which the evaluation is paused. A tracepoint is a point in the evaluation that is recorded; tracepoints thus provide a traceable path of evaluation results.
3.If you click Start Debugger, evaluation is carried out in one step to the end unless a breakpoint has been marked in the expression. Click Start Debugger repeatedly to progress through each breakpoint to the end of the evaluation.
4.Use the Step Into/Out/Over functionality to go step-by-step through the evaluation.
|

Stepping in, out, and over evaluation steps
The Step Into functionality enables you to go step-by-step through the evaluation. Each click of this command takes you through the next step of the evaluation; the current step is shown by the highlighting in the expression (see screenshot below). The Step Out functionality takes you to a step on a higher level as the current step, whereas the Step Over functionality steps over lower-level steps and takes you to the next step on the same level. You can try out the Stepping functionality by using the expression shown in the screenshot below and clicking the three Step buttons to see how they work.
The screenshot below shows the evaluation when processing has been paused on reaching the locator step newsitem. At this step, the result shows the four newsitem node.
Breakpoints
Breakpoints are points where you want the Debugger to stop after it has been started with Start Debugger. They are useful if you wish to analyze a specific part of the expression. When the Debugger stops at the breakpoint, you can check the result and could then use the Step Into functionality to display the results of the next steps of the evaluation. To set a breakpoint, place the cursor in the expression at the point where you want the breakpoint, and click the Insert/Remove Breakpoint (F9) toolbar button. The breakpoint will be marked with a dashed red overline. To remove a breakpoint, select it and click Insert/Remove Breakpoint (F9).
Also see Debug Points below.
Tracepoints
Tracepoints are points at which the results are recorded. These results are displayed in the Traces tree of the Result tab (see screenshot below). This enables you to see all the evaluation results of particular parts of the expression. For example, in the screenshot below, tracepoints have been set on the team node and member node. The results at these tracepoints are shown in the Traces tree.
To set a tracepoint, place the cursor at the point where you want the tracepoint, and click the toolbar button Insert/Remove Tracepoint (Shift+F9). The tracepoint will be marked with a dashed blue overline (see screenshot below). To remove a tracepoint, select it and click Insert/Remove Tracepoint (F9).

Note: If both a breakpoint and a tracepoint are set on a part of the expression, then the overline is composed of alternating red and blue dashes.
Also see Debug Points below.
Variables, Watch Expressions, and Call Stack
Variables and watch expressions are displayed in the Variables and Watch Expressions pane (bottom center pane in the screenshot below).

Variables
Variables that have been declared in the expression and that are in scope in the current evaluation step will be displayed together with their respective current values. For example, in the screenshot above, processing has been paused at the breakpoint on headline. The $i variable is in scope at this evaluation step. So $i is displayed with its current value, which in the screenshot above is the first newsitem node.
Watch expressions
Watch expressions are expressions that you can enter, either before evaluation starts or during a pause in evaluation. They can be used for the following purposes:
•To test specific conditions. For example in the screenshot above, the watch expression $i/metainfo/enteredBy/@id="NED" is used to test whether this news item has been entered by the team member with the id of NED. The result true in the case of the first news item tells us that this condition has been met.
•To find data within a certain context. For example, within the context of a Company element, we could enter a watch expression @id to look up that company's customer code in the target XML document.
•To generate additional data. For example, a suitable string can be generated to indicate the total number of news items..
To enter a watch expression, click Add Watch Entry in the pane's toolbar (encircled in red in the screenshot above), then enter the expression and click Enter when done. To remove a watch expression, select it and click Remove Selected Watch Entry in the toolbar. If, during debugging, the expression cannot be correctly evaluated for some reason (for example, if one of its variables is out of scope), then the watch expression turns red.
Call stack
The Call Stack tab of the Call Stack and Debug Points pane (bottom right pane in the screenshot above) displays the processor calls up to that point in the debugging. The current processor call is highlighted in yellow. Note that only the calls that directly led to the current evaluation step are displayed.
Debug Points
The Debug Points tab of the Call Stack and Debug Points pane (bottom right pane in the screenshot below) shows the breakpoints (with solid red circles) and tracepoints (solid blue circles) that you have set on the expression. Each debug point is listed with its line and character number. For example, AxisStep@2:12 means that there is a debug point on line 2, character 12 of the expression in the Expression pane.

Note the following features:
•For breakpoints, you can enter a break condition by (i) double-clicking Enter break condition in the Debug Points pane, (ii) entering the expression for the condition, and (iii) pressing Enter. That breakpoint will be enabled only when the condition evaluates to true. For example, in the screenshot above, the break condition $i/metainfo/enteredBy/@id="ABE" will enable the breakpoint on the headline of each news item that was entered by the team member with the id ABE. The screenshot shows the evaluation paused at this breakpoint. (Notice also that the Watch expression at this breakpoint returns false.)
•You can enable/disable all debug points by clicking their respective toolbar buttons: Enable All Debug Points and Disable All Debug Points (buttons encircled in green in the screenshot above). When a debug point is disabled, it is deactivated for all evaluations till it is enabled again.
•You can enable/disable individual breakpoints in their respective context menus.
Toolbar commands in panes
The panes of the Edit XPath Expression dialog in Debug Mode (see screenshot above) contain buttons that provide navigation, search, and copy functionality. These buttons, starting from the left, are described in the table below. The corresponding commands are also available in the context menu of listed items.
Icon | What it does |
Next, Previous | Selects, respectively, the next and previous item in the result list |
Copy the selected text line to the clipboard | Copies the value column of the selected result item to the clipboard. To copy all columns, toggle on the Copying includes all columns command (see below) |
Copy all messages to the clipboard | Copies the value column of all result items to the clipboard, including empty values. Each item is copied as a separate line |
Copying includes all columns | Switches between copying (i) all columns, or (ii) only the value column. The column separator is a single space |
Find | Opens a Find dialog to search for any string, including special characters, in the result list |
Find previous | Finds the previous occurrence of the term that was last entered in the Find dialog |
Find next | Finds the next occurrence of the term that was last entered in the Find dialog |
Expand with children | Expands the selected item and all its descendants |
Collapse with children | Collapses the selected item and all its descendants |
Clear | Clears the result list |