Example: Chart Functions
The example XSLT document below shows how Altova extension functions for charts can be used. Given further below are an XML document and a screenshot of the output image generated when the XML document is processed with the XSLT document using the XSLT 2.0 or 3.0 Engine.
Note: Chart functions are supported only in the Enterprise and Server Editions of Altova products.
Note: For more information about how chart data tables are created, see the documentation of Altova's XMLSpy and StyleVision products.
XSLT document
This XSLT document (listing below) uses Altova chart extension functions to generate a pie chart. It can be used to process the XML document listed further below.
<?xml version="1.0" encoding="UTF-8"?>
<xsl:stylesheet version="2.0"
xmlns:xsl="http://www.w3.org/1999/XSL/Transform"
xmlns:xs="http://www.w3.org/2001/XMLSchema"
xmlns:altovaext="http://www.altova.com/xslt-extensions"
exclude-result-prefixes="#all">
<xsl:output version="4.0" method="html" indent="yes" encoding="UTF-8"/>
<xsl:template match="/">
<html>
<head>
<title>
<xsl:text>HTML Page with Embedded Chart</xsl:text>
</title>
</head>
<body>
<xsl:for-each select="/Data/Region[1]">
<xsl:variable name="extChartConfig" as="item()*">
<xsl:variable name="ext-chart-settings" as="item()*">
<chart-config>
<General
SettingsVersion="1"
ChartKind="Pie3d"
BKColor="#ffffff"
ShowBorder="1"
PlotBorderColor="#000000"
PlotBKColor="#ffffff"
Title="{@id}"
ShowLegend="1"
OutsideMargin="3.2%"
TitleToPlotMargin="3.%"
LegendToPlotMargin="6.%"
>
<TitleFont
Color="#023d7d"
Name="Tahoma"
Bold="1"
Italic="0"
Underline="0"
MinFontHeight="10.pt"
Size="8.%" />
</General>
</chart-config>
</xsl:variable>
<xsl:sequence select="altovaext:create-chart-config-from-xml( $ext-chart-settings )"/>
</xsl:variable>
<xsl:variable name="chartDataSeries" as="item()*">
<xsl:variable name="chartDataRows" as="item()*">
<xsl:for-each select="(Year)">
<xsl:sequence select="altovaext:create-chart-data-row( (@id), ( .) )"/>
</xsl:for-each>
</xsl:variable>
<xsl:variable name="chartDataSeriesNames" as="xs:string*" select=" ( ("Series 1"), '' )[1]"/>
<xsl:sequence
select="altovaext:create-chart-data-series-from-rows( $chartDataSeriesNames, $chartDataRows)"/>
</xsl:variable>
<xsl:variable name="ChartObj" select="altovaext:create-chart( $extChartConfig, ( $chartDataSeries), false() )"/>
<xsl:variable name="sChartFileName" select="'mychart1.png'"/>
<img src="{$sChartFileName, altovaext:save-chart-image( $ChartObj, $sChartFileName, 400, 400 ) }"/>
</xsl:for-each>
</body>
</html>
</xsl:template>
</xsl:stylesheet>
XML document
This XML document can be processed with the XSLT document above. Data in the XML document is used to generate the pie chart shown in the screenshot below.
<?xml version="1.0" encoding="UTF-8"?>
<Data xmlns:xsi="http://www.w3.org/2001/XMLSchema-instance"
xsi:noNamespaceSchemaLocation="YearlySales.xsd">
<ChartType>Pie Chart 2D</ChartType>
<Region id="Americas">
<Year id="2005">30000</Year>
<Year id="2006">90000</Year>
<Year id="2007">120000</Year>
<Year id="2008">180000</Year>
<Year id="2009">140000</Year>
<Year id="2010">100000</Year>
</Region>
<Region id="Europe">
<Year id="2005">50000</Year>
<Year id="2006">60000</Year>
<Year id="2007">80000</Year>
<Year id="2008">100000</Year>
<Year id="2009">95000</Year>
<Year id="2010">80000</Year>
</Region>
<Region id="Asia">
<Year id="2005">10000</Year>
<Year id="2006">25000</Year>
<Year id="2007">70000</Year>
<Year id="2008">110000</Year>
<Year id="2009">125000</Year>
<Year id="2010">150000</Year>
</Region>
</Data>
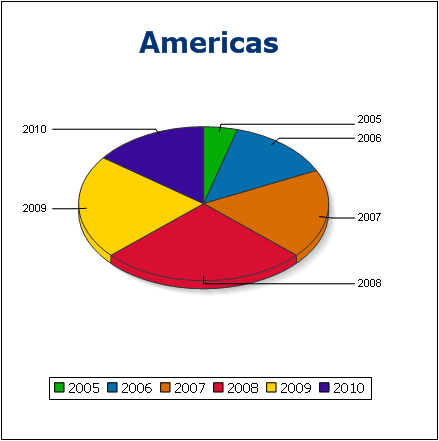
Output image
The pie chart show below is generated when the XML document listed above is processed with the XSLT document.