Solution Usage Statistics
Statistics of solution usage can be viewed in the Statistics solution, which is located by default in the /admin container. The Statistics solution displays a variety of statistics about individual solutions over a user-selected period. A variety of filters is available, which enables you to see such usage data as the number of users, the type of device or OS, peak-time usage, etc.
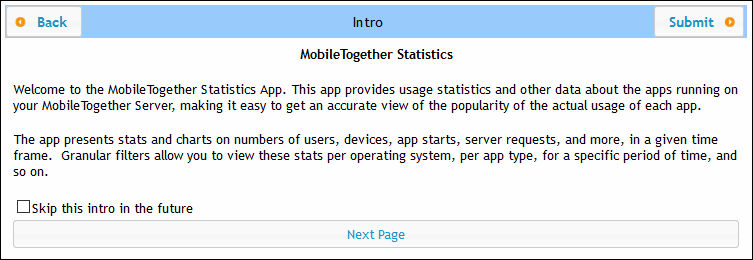
The screenshot below shows the intro page of the Statistics solution.
Statistics solution: setting up
From MobileTogether Server version 4.0 onwards, the Statistics solution is pre-deployed with MobileTogether Server, and is located in the /admin container. The Statistics solution is periodically updated to provide improved reporting. To make use of the latest features of the solution, we recommend that you update to the latest version of the Statistics solution.
If your version does not have the Statistics solution pre-deployed (because it is an older version than 4.0) or if you want to update to the latest version of the solution, do the following:
1.Update your MobileTogether Server software to the latest version (currently 10.4).
2.Access the MobileTogether Server administrator interface in a web browser by typing this URL: http://<serverIPAddressOrName>:8085/.
3.Enter your login information and go to the Workflows tab.
4.Click Create Container, type admin as the container name, and click Save and go there.
5.In MobileTogether Designer, open the Statistics.mtd file. This file is located in the Solutions folder of your MobileTogether Server AppData folder (see table below).
6.After the file Statistics.mtd has been opened in MobileTogether Designer, deploy it to the /admin container of MobileTogether Server. Use MobileTogether Designer's menu command File | Deploy to MobileTogether Server to do this.
7.In the MobileTogether Server administrator interface, go to the Settings tab and, in the Statistics pane of the Misc tab, set Statistics Limit to a positive integer to activate the tracking of statistics data.
8.To see solution statistics from this time onwards, start the Statistics solution. Do this as follows: In MobileTogether Server, go to the Workflows tab, open the /admin container, and start the Statistics solution. Alternatively, enter this URL: http://<serverIPAddressOrName>:8085/run?d=/admin/Statistics/.
Note: You can deploy the Statistics solution to any container you like. To run the solution, modify the solution's URL to take the correct container into account.
Location of the MobileTogether Server AppData folder on various operating systems
Linux | /var/opt/Altova/MobileTogetherServer2026 |
Windows | C:\ProgramData\Altova\MobileTogetherServer2026 |
Statistics solution: description
The Statistics solution interface (screenshot below) consists of three tabs:
•Users/Devices/Requests
•Usage by time of day
•OS/Manufacturer/Platform/Device kind
The name of the active tab is displayed in red (see screenshot).
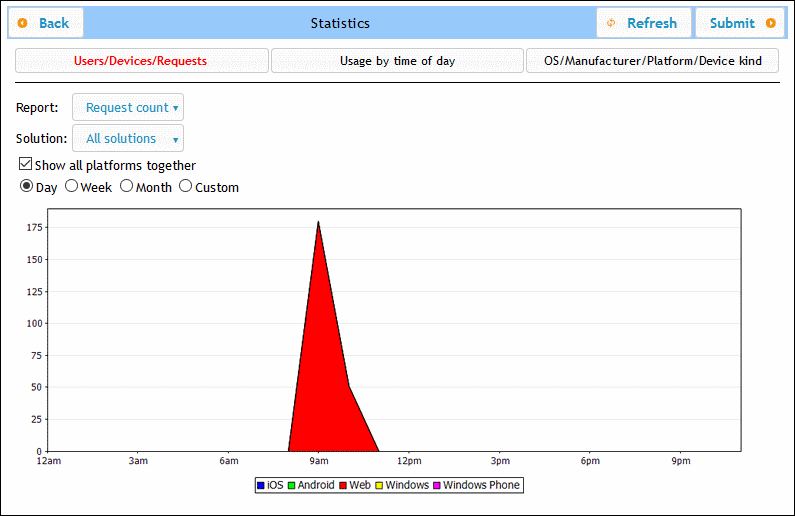
Each tab has two or three filters. One of the filters in each tab is always the Solution filter. This enables you to select a single solution from all the solutions deployed to the server; alternatively, you can select all solutions. The other filter/s enable you to select what category of statistics to display. You can also select a time interval for which the statistics are to be displayed.
Users/Devices/Requests
Shows statistics for different platforms separately, with each platform being indicated by a different color (see screenshot above). If you uncheck Show all platforms together, you can use the Platform filter to select the platform (iOS, Android, Web, Windows, and Windows Phone) to display. In the Report filter, you can select from among the following:
•Users: the number of users.
•Devices: the number of devices.
•Request count: The number of requests.
•Request time total (sec): Total time (in seconds) used to process requests.
•Request time average (ms): Average time (in milliseconds) for processing a single request.
•Request time maximum (ms): Processing time (in milliseconds) of the request that took the longest to process.
•Solution starts: The number of solution starts, subdivided by platform.
•Incoming traffic (MB): Total incoming traffic (in MB) from MT clients; does not include HTTP traffic from other servers to the MT server.
•Outgoing traffic (MB): Total outgoing traffic (in MB) to MT clients; does not include HTTP traffic from the MT server to other servers.
•Files read: Number of files read on the server.
•Files read size (MB): Total size of all files read on the server.
•Files written: Number of files written on the server.
•Files written size (MB): Total size of all files written on the server.
•Database read/writes: Number of read/writes from/to DBs used in the solution; does not include MT internal database.
•HTTP requests: Number of HTTP requests from MT server to other servers.
•HTTP requests incoming traffic (MB): Incoming HTTP traffic (in MB) from other servers to the MT server; does not include traffic with MT clients.
•HTTP requests outgoing traffic (MB): Outgoing HTTP traffic (in MB) from the MT server to other servers; does not include traffic with MT clients.
•Images: Number of images loaded on the server; does not include charts.
•Charts: Number of charts created on the server.
•Chart time total (sec): Total time (in seconds) used to generate charts on server.
•Chart time average (ms): Average time (in milliseconds) for generating a single chart.
•Chart time maximum (ms): Longest time (in milliseconds) needed to generate a single chart.
If you select Show all platforms together, then all platforms (iOS, Android, Web, Windows, and Windows Phone) are shown together in one graphic, with each platform being represented by a different color. If Show all platforms together is unselected, then the graphic for each platform can be shown separately by selecting the respective platform in the Platform filter.
Usage by time of day
Shows intensity of usage of the selected solution in two-hour time segments across a period of 24 hours for each day of the past week. If you uncheck Show all platforms together, you can use the Platform filter to select the platform (iOS, Android, Web, Windows, and Windows Phone) to display. In the Report filter, you can select from among the following:
•Users: the number of users.
•Devices: the number of devices.
•Request count: The number of requests.
•Request time total (sec): Total time (in seconds) used to process requests.
•Request time average (ms): Average time (in milliseconds) for processing a single request.
•Request time maximum (ms): Processing time (in milliseconds) of the request that took the longest to process.
•Solution starts: The number of solution starts, subdivided by platform.
•Incoming traffic (MB): Total incoming traffic (in MB) from MT clients; does not include HTTP traffic from other servers to the MT server.
•Outgoing traffic (MB): Total outgoing traffic (in MB) to MT clients; does not include HTTP traffic from the MT server to other servers.
•Files read: Number of files read on the server.
•Files read size (MB): Total size of all files read on the server.
•Files written: Number of files written on the server.
•Files written size (MB): Total size of all files written on the server.
•Database read/writes: Number of read/writes from/to DBs used in the solution; does not include MT internal database.
•HTTP requests: Number of HTTP requests from MT server to other servers.
•HTTP requests incoming traffic (MB): Incoming HTTP traffic (in MB) from other servers to the MT server; does not include traffic with MT clients.
•HTTP requests outgoing traffic (MB): Outgoing HTTP traffic (in MB) from the MT server to other servers; does not include traffic with MT clients.
•Images: Number of images loaded on the server; does not include charts.
•Charts: Number of charts created on the server.
•Chart time total (sec): Total time (in seconds) used to generate charts on server.
•Chart time average (ms): Average time (in milliseconds) for generating a single chart.
•Chart time maximum (ms): Longest time (in milliseconds) needed to generate a single chart.
OS/Manufacturer/Platform/Device kind
For each criterion (OS, manufacturer, platform, and device kind), shows usage of the selected solution in terms of proportions of that criterion's instances. For example, for the platform criterion, each platform is shown as a proportion of total usage. The graphic in each case is a pie chart, with each instance of the criterion shown as a slice of the pie. In the Report filter, you can select from among the following:
•OS: Each OS is shown in a different color.
•Manufacturer: Each manufacturer is shown in a different color.
•Platform: Each platform is shown in a different color.
•Device kind: Each device kind is shown in a different color.