Creating and Configuring Charts
This section:
•The Chart Configuration dialog
•Editing chart settings and data selection
Creating a chart
To insert a chart in the design, drag the Chart control from the Controls Pane to the location in the design where you wish to insert the chart.
The context node
Drag an XML node from the Page Sources Pane onto the chart in the design to make this XML node the context node of the chart's XPath expressions. You can change the chart's context node at any time by dragging a new XML node onto the chart. It is important to be aware of the chart's context node because this context node is the starting point of path locators in XPath expressions.
The Chart Configuration dialog
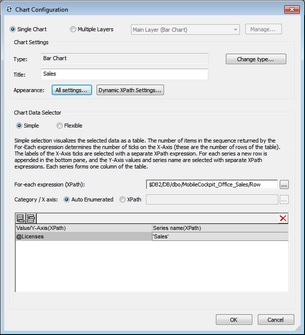
A chart can be configured in the Chart Configuration dialog (screenshot below) at the time that the chart is created. Configuring a chart involves: (i) specifying data selection for the charts's axes, and (ii) defining the chart's properties. These settings can be edited at any later time. After assigning an XML context node to the chart, do either of the following to bring up the Chart Configuration dialog:
•Double-click the chart
•Select the chart in the design, then click the Edit XPath button of the Chart Settings property in the Styles & Properties Pane
The Chart Configuration dialog has three parts:
•Single or Multiple layers: Multiple layers can be selected to create overlay charts; charts are overlaid one upon the other to produce a composite
•Chart Settings: To select the chart type and define the appearance of the chart
•Chart Data Selection: To select the data for the various axes of the chart using either the simple option or flexible option
Editing chart settings and data selection
If you wish to change chart settings or a chart's data selection after a chart has been created, right-click the chart in the design and select Chart Creation Settings. The Chart Configuration dialog (screenshot above) of that chart appears. You can edit the chart's settings or data selection in the dialog, then click OK to finish.
