Enter Data
You can fill a report with data by entering data into cells manually or by pasting values. With some cells, you can select a value from a predefined list, such as countries or currencies. In some report tables, you may need to add new rows or columns. Below you will find information about how to enter data.
Editable vs. non-editable cells
As a general rule, gray cells must not be edited. Only cells that are included in the XBRL-bound area (delimited by the table boundaries) are to be edited. For information about various cells and data to be entered, consult the cell information (properties) displayed in the Cell tab of the Solvency II Report Pane.
Paste data
If you paste data from multiple columns, the number of pasted columns should correspond to the number of columns in the predefined sheet. If you accidentally paste a larger number of columns or type text outside the default table, unwanted columns may appear outside the XBRL-bound area. To delete the unwanted columns, right-click the cell and select Delete | Table Columns. To prevent Excel from adding new columns and rows automatically, go to File | Options | Proofing | AutoCorrect Options | AutoFormat As You Type | Apply as you work and clear the Include new rows and columns in table check box.
When you paste data, it is recommended to keep only the values but not the formatting. To do this, select the Paste Values option when you paste cells or rows.
Actual vs. displayed cell value
While generating the XBRL instance file, the add-in ignores any cell formatting information and exports the actual value of the Excel cell. However, bear in mind that the actual value may be different from the value displayed in the cell because of the cell formatting information. You can see the actual value that will be written to the XBRL instance in the formula bar of Excel (see example below).
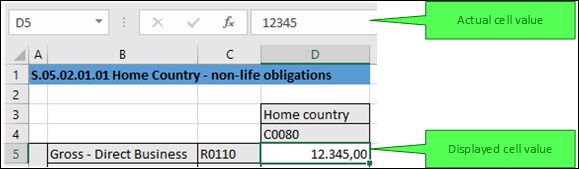
In the example above, the value that will be written to the XBRL instance is 12345. Note that the number accuracy reported in the XBRL instance file also depends on the value you selected for the Accuracy properties. For more information about the accuracy of cells, see Control Accuracy of Cells.
Enumeration values
Some cells expect a fixed predetermined value (e.g., cells that represent currencies or countries). In this case, the add-in displays a small tooltip when you click the cell. You can choose the required value from the drop-down list:
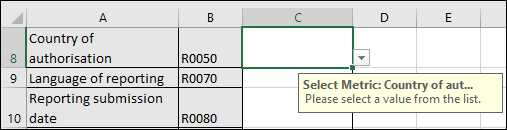
To view the full list of all possible values, click the cell and see the cell properties in the Cell tab of the Solvency II Report Pane.
Conditional cells
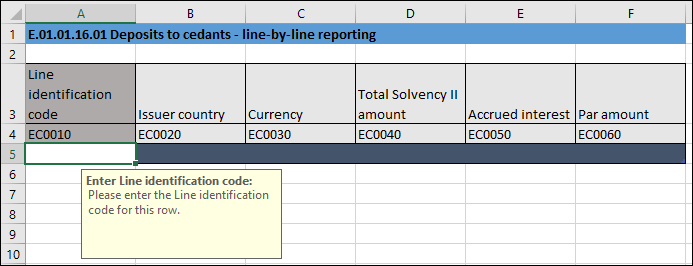
In some tables, you must first fill out a cell value in order to make other cells of the table editable. For example, cells A5 and B5 must be filled in before all the other cells in the same row can be edited (see screenshot below).
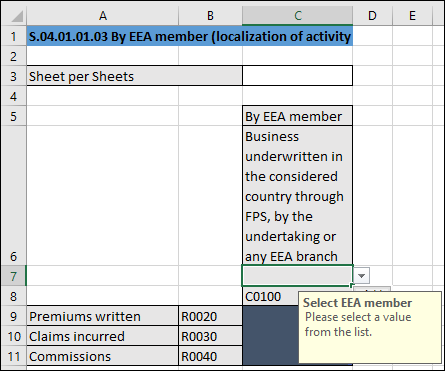
Conditional cells can unlock cells not only from the same row but also from the same column. For example, in the table below, cell C7 must first be filled in so that cells C9-C11 can be edited:
Cells with multiple values
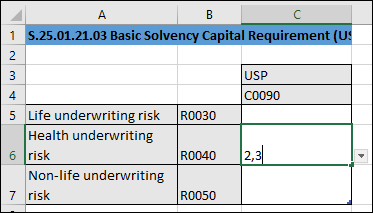
Depending on the XBRL taxonomy, some reports might have facts that represent a list of comma-separated multiple values. As a result, the corresponding cell also requires multiple values to be entered in the same cell. For example, Table S.25.0.1.21.0.3, available through the entry point 21 - Annual Solvency II public disclosure Solo, contains cells that take multiple values. To enter data for such cells, expand the drop-down list and click all the relevant items. Alternatively, you can type all the numeric values, separated by a comma (see screenshot below). Remember that you can view all possible values of a cell in the Cell tab of the Solvency II Report Pane.
After you exit the cell with multiple values, this cell is automatically re-drawn to display all selected values in a readable form (even though you may have entered only numbers).
New rows
With some tables, you may need to create new rows. For example, this is the case for Table S 01.03.01.01 available through the entry point Solvency II 2.3 - Annual Solvency II Reporting Solo. You can add new rows using the standard Excel commands or shortcuts. Alternatively, you can click the Add Row button in the ribbon. For example, to add a new row to Table C 10.02 of the entry point mentioned above, do one of the following:
•Open the add-in tab in the Excel ribbon and click Add Row | Insert Row Below. Note that the commands to insert or delete rows are enabled only if adding new rows is supported for this table.
•Click the rightmost cell of the last row in the table and press Tab.
•Right-click a cell in the empty row and select Insert | Table Row Below from the context menu.
Note: Any newly added rows must be within the XBRL-bound area of the table, clearly delimited by black lines.
New columns
For some tables, you may need to add extra columns, which means these tables can grow horizontally. For example, this is the case for Table S.04.01.01.03 available through the entry point Solvency II 2.3 - Annual Solvency II Reporting Solo. You can add new columns to such tables in one of the following ways:
•Open the add-in tab in the Excel ribbon and click Add Column. Note that this command is enabled only if adding new columns is supported for this table.
•Click the Add button that appears next to the rightmost column of a table.
•Right-click a table cell and select Insert | Table Columns to the Right from the context menu.