The most powerful XML editor for professionals. Edit, validate, and transform XML with an industry-leading IDE trusted by 5.4 million developers worldwide.
XMLSpy JSON and XML Editor gives developers the tools they need to build the most sophisticated applications with its graphical schema designer, code generation, file converters, debuggers, and profilers for working with XSD, XSLT, XQuery, XBRL, SOAP, and more.
New! Altova AI integration and more new features in Version 2026 Release 2 available May 27, 2026.
Developers need a JSON and XML editor that adds value beyond bracket matching and basic validation checking. XMLSpy provides the comprehensive feature set below and includes graphical views, code generators, wizards, and other intelligent JSON and XML editing functionality that help you get the job done faster than ever.
Check out this overview of XML and JSON Tools in XMLSpy XML Editor
An XML editor lets you create and modify XML documents. But when your work involves mission-critical data — healthcare records, XBRL taxonomies, enterprise integration schemas — a general-purpose text editor isn't enough. You need real-time validation, intelligent auto-completion, and an environment built specifically for structured data.
A professional XML editor download lets you focus your expertise on architecture, logic, and data quality, instead of wrestling with syntax and matching brackets. With XMLSpy, you can validate documents instantly against DTDs and XSDs and even apply corrections automatically, catching errors during development rather than in production. Unique visual editors immediately increase productivity and let you get even more value from your JSON and XML data. You can design complex schemas graphically instead of hand-coding them, and debug and optimize XSLT transformations with dedicated graphical tools. You get native support for XPath, XQuery, SOAP, JSON, and YAML alongside XML, with built-in converters and generators. And when it comes to regulated data like XBRL, only XBRL-Certified software like XMLSpy meets the standard.
The right professional XML editor eliminates the patchwork of plugins that lighter tools demand and gives you one environment for every XML task. That’s why XMLSpy is trusted by 91% of the Fortune 500 and millions of developers worldwide.
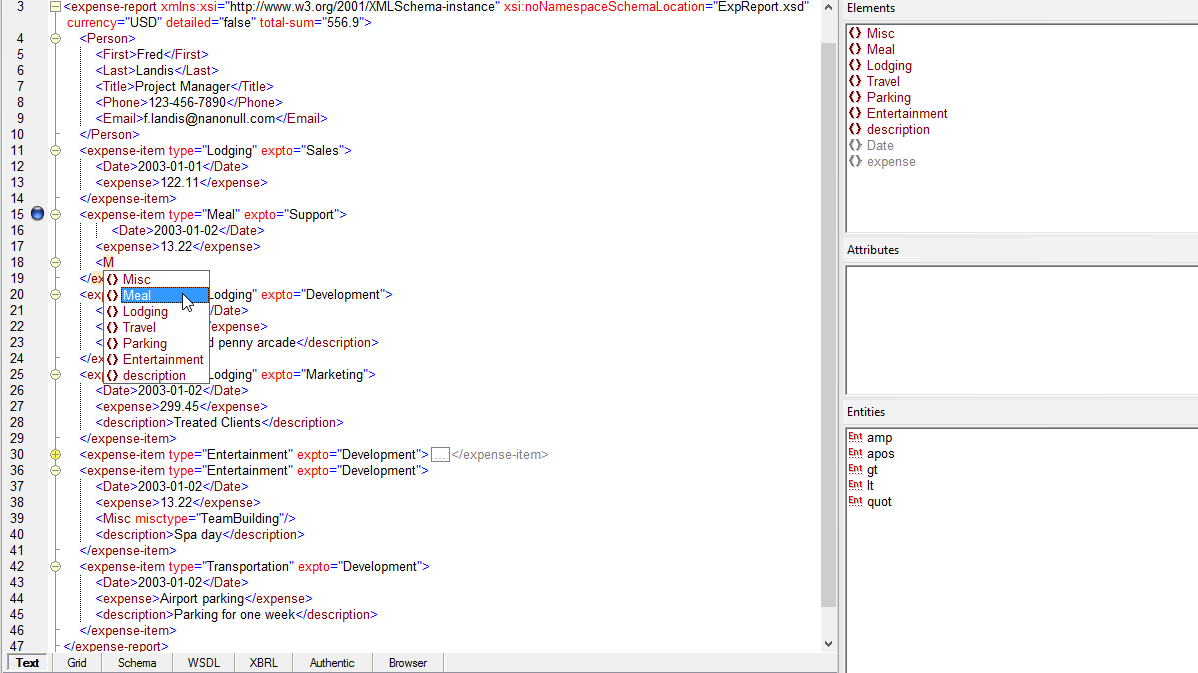
XMLSpy abstracts away the complexity of editing XML and related technologies through its intuitive user interface and rich variety of views and options. Whether you prefer to edit XML documents in a text-based or graphical XML viewer, XMLSpy provides intelligent guidance and entry-helpers as you type, and troubleshooting is fast and easy with the industry's most standards-conformant XML validator.
XML Grid View displays the XML document structure using a set of nested containers that reflects its hierarchical structure. It also includes table view that rearranges repeating elements in a table for easy viewing and sorting. By default, XML Grid View uses attributes and child elements for the columns, and shows repeating XML element as row - but you can flip rows and columns to adapt the display based on the type of data the file.
XML Grid makes XML editing faster and more powerful than when using a text editor alone. Advanced features include:
XML Grid will revolutionize the way you edit XML documents. Take a look at this quick video demo.
Watch the XML Grid Demo
As you work, XMLSpy provides Smart Fix XML validation, a process that detects errors - and then enumerates the possible corrections for fixing them, which you can choose to implement in your XML document with one click. That's right - XMLSpy will make the corrections automatically, based on your selection. Because the XML validator can make the corrections automatically, it saves you significant time and frustration associated with resolving validation issues.
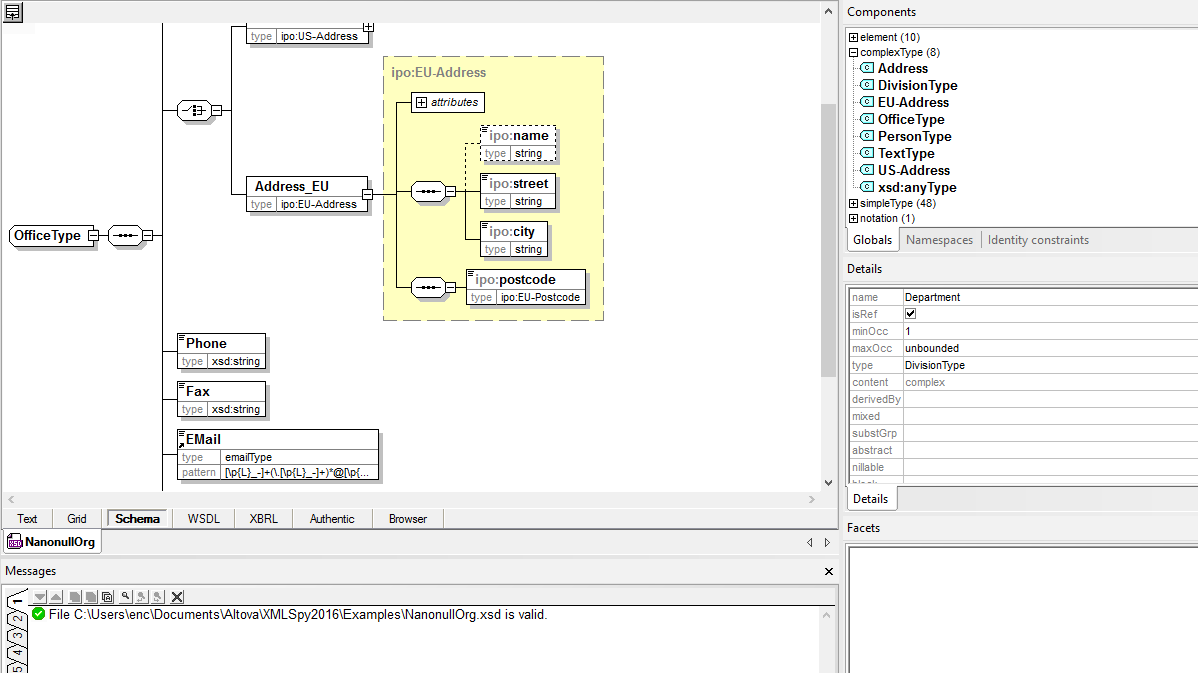
The graphical XML Schema editor in XMLSpy allows you to create schemas in a visual, drag-and-drop manner, so you can focus on the semantics of your schema while leaving the syntactical details of the XML Schema language to XMLSpy. In addition to rich XML Schema 1.0 and 1.1 editing and validation, the following XSD tools are provided:
XMLSpy includes an intuitive JSON viewer and JSON editor with support for JSON, JSON5, JSON Lines, and JSON Comments, allowing you to view and edit JSON files using the same intuitive Text and Grid Views available for XML editing, with useful editing guides and entry helpers. The JSON editor provides:
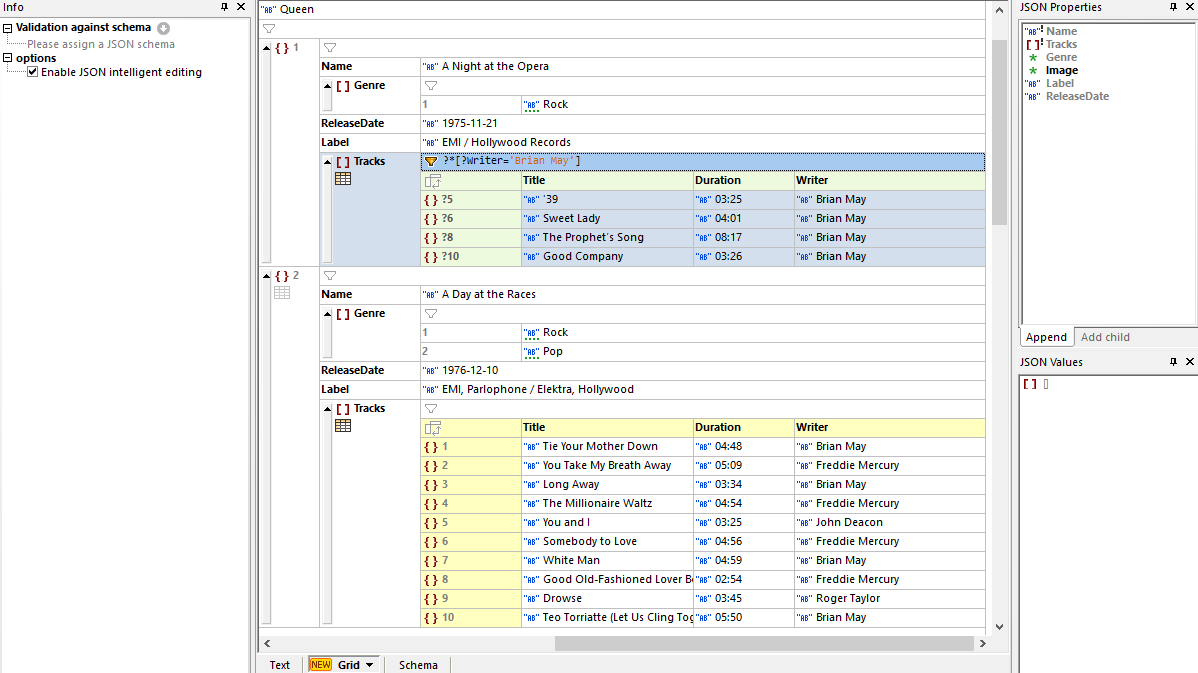
A revolutionary, first-of-its-kind JSON editing environment is provided by XMLSpy JSON Grid View. JSON Grid provides a graphical representation of the JSON document structure that is immediately easier to understand than the corresponding JSON code in text view, especially for long, complex documents with multiple nested levels of arrays and objects. Advanced features such as automatic type detection, in-cell commands, XQuery filters for modifying the view, XQuery formulas for generating additional output from the JSON data, and more, combine to make JSON editing faster and easier than a text-based JSON editor. JSON Grid even allows you to create charts from JSON data.
Watch the JSON Grid Demo
In addition to utilizing XQuery for filters and formulas in JSON Grid, you can use it to create charts from numerical JSON data.
After configuring a chart function, the save icon embeds the chart in the JSON file as a base-64 encoded image. Or, simply right-click on the chart to save it in an image file such as .png or .jpg.
No other JSON editor offers anything even close to this functionality!
Just as XMLSpy pioneered the first graphical XML Schema editor, it now also includes the first enterprise-grade, graphical JSON Schema editor to greatly speed schema generation, development, and validation for developers working with JSON.
JSON Schema View will be immediately familiar to XMLSpy customers who’ve used XML Schema View and are now learning to design JSON Schemas, while at the same time being easy to comprehend for new users. Use the JSON Schema editor for:
The JSON Schema editor supports BSON (binary JSON) datatypes used in NoSQL databases such as MongoDB.
Despite the growing popularity of JSON, there isn't a widely used language for querying and transforming JSON data. Luckily, functionality added to XPath/XQuery 3.1 provides a means for targeting JSON maps, arrays, and objects, offering a standardized way to query and transform JSON data using these familiar languages.
XMLSpy makes it easy to process JSON documents with XPath, XSLT, and XQuery using intelligent editors and the interactive XPath/XQuery Builder & Evaluator Window. Functionality includes:
Learn How to Query JSON with XSLT and XPath/XQuery
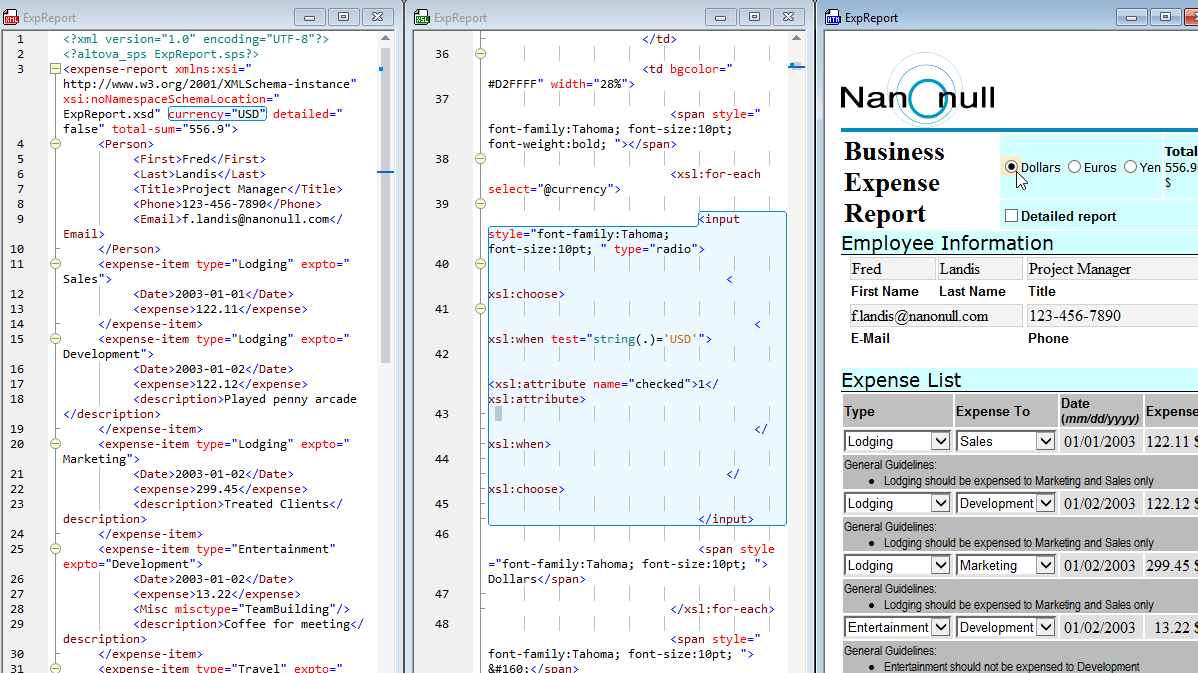
The JSON and XML Editor provides complete support for XSL and XSLT development in its XSLT editor with context-sensitive entry helpers, an XSL outline window, and more.
For transformation, seamless integration with installed RaptorXML Servers delivers hyper-performance functionality coupled with strict conformance to W3C standards, including XSLT, XPath, and XQuery versions 1.0, 2.0, and 3.1. This allows you to take advantage of super-fast transformations during development and testing, all directly inside XMLSpy.
XMLSpy even includes intelligent HTML and CSS editors along with an integrated browser view.
Testing and perfecting XSLT stylesheets can be a complicated, time-consuming process. With the XMLSpy XSLT debugger, you can step through and debug even the most intricate stylesheets quickly and easily. Support for XSLT 1.0, XSLT 2.0, and XSLT 3.0 is provided, and you can even debug stylesheets that contain program code in Java, C#, JavaScript, or VBScript.
The XMLSpy XSLT profiler is an invaluable tool for optimizing the performance of your XSLT code. Based on the information revealed by the XSLT profiler, you can immediately see which parts of your XSLT code are taking the most time to process and adjust them accordingly to fully optimize your XSLT stylesheets.
The XSLT profiler delivers important information for expert XSLT developers, but if you want to speed up XSLT execution time without manually changing your XSLT and XPath code, try the XSL Speed Optimizer.
The XSL Speed Optimizer in XMLSpy is a revolutionary, patented approach to speeding up XSLT transformations, providing tremendous increases in throughput with no manual analysis required to determine exactly which XSLT or XPath expressions are causing bottlenecks.
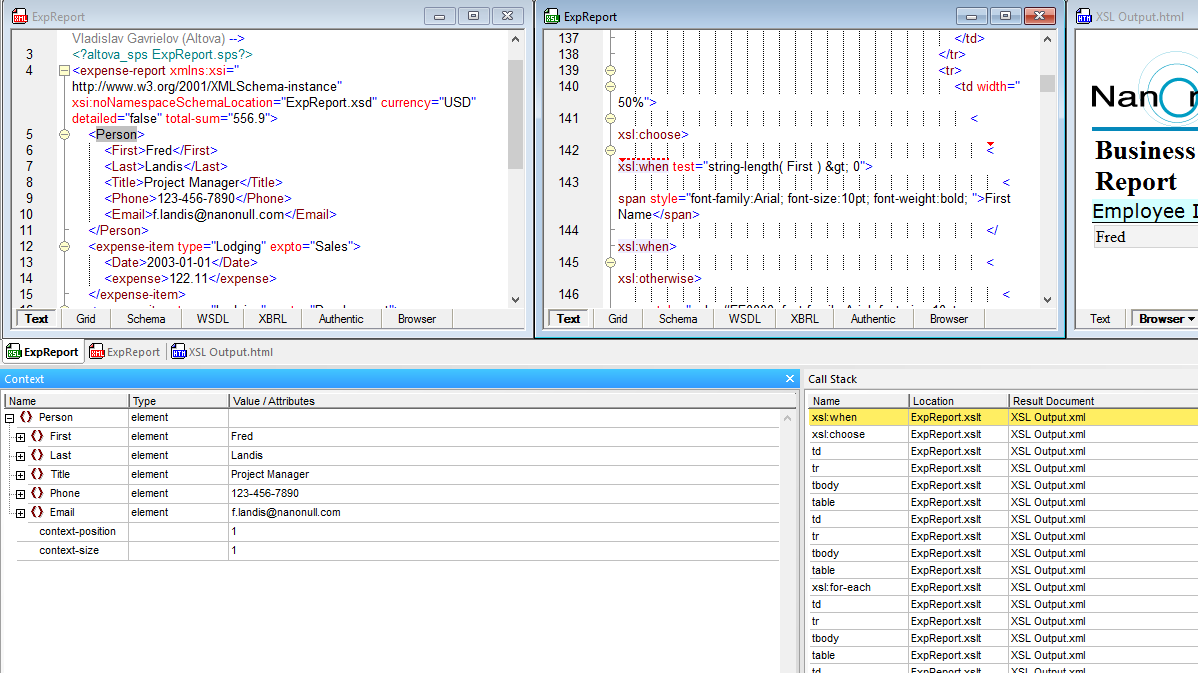
Because XSLT and XQuery documents are frequently long and complex, it can be difficult to identify the source of unintended output. For targeted debugging, back-mapping makes it easy to immediately correlate output elements to source nodes and instructions.
With back-mapping enabled, XSLT transformations and XQuery executions are carried out so that the result document can be mapped back on to the originating XSLT+XML or XQuery+XML documents. When you click on a node in the result document, the XSLT instruction and the XML source data that generated that particular result node will be highlighted.
Back-mapping in XMLSpy is revolutionary in two ways. First, it saves developers considerable time in debugging, refining, and perfecting their code as well as understanding inherited code written by other team members. Second, XMLSpy does not make any changes or add additional code to the output document in order to achieve back-mapping.
Check out XSLT Back-mapping and XQuery Back-mapping in action
Generate XSLT for XML to XML data mapping
Generate XSLT for multi-channel publishing
The XPath and XQuery window makes it easy to build and test your XPath/XQuery expressions as you compose them with built-in Builder and Evaluator windows. Helpful functionality to speed development is provided through:
Watch this demo of XPath editing and testing tools in XMLSpy
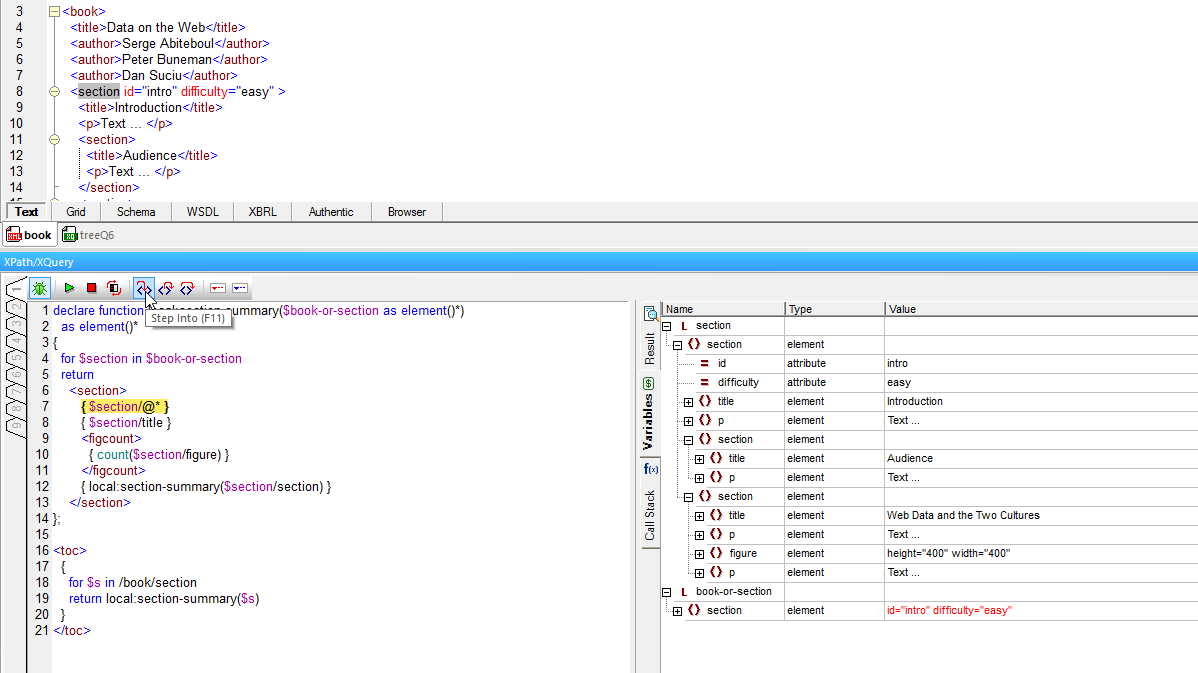
For working with large XQuery documents, XMLSpy provides native support for XQuery 1.0 and XQuery 3.1 with all the intelligent editing functionality you need to edit XQuery documents quickly and easily. Support for schema-awareness in the XQuery editor allows you to harness the full power of XQuery through mechanisms for error isolation, simplified debugging, and enhanced code performance.
The powerful XPath and XQuery window also includes a powerful Debugger for testing, troubleshooting, and perfecting your XPath/XQuery to save time and reduce frustration.
The debugger lets you go step-by-step through the evaluation of your XPath or XQuery expression. Each click shows you the results for the corresponding step of the evaluation, and you can step into, step out, and step over evaluation steps using helpful buttons in the debugger toolbar.
An advanced XQuery Profiler is also provided, helping you analyze and optimize your XQuery code performance.
Targeted debugging is also provided via XQuery back-mapping.
The XPath/XQuery window in the XML Editor also supports editing XQuery Update Facility (XQUF) 1.0 and 3.0 statements with advanced functionality for composing XQuery Update Facility expressions with full syntax coloring, intelligent code completion, and error message reporting.
The results pane lets you preview the results of the changes, and clicking on a result in the preview pane highlights the affected node in your instance document. Then, you can execute the updates with one click, either in the current file or across all open files, a folder, or an entire XMLSpy project. This functionality is unique to XMLSpy.
Watch the XQuery Update Facility Editor in action
XMLSpy includes powerful diff/merge tools to compare JSON documents and other text files, as well as directories. For file comparisons, 2- and 3-way comparisons are supported. Users can edit documents and merge changes in either direction.
For XML comparisons, the XMLSpy XML editor includes includes a visual XML compare tool that allows developers to easily compare XML and merge documents and directories in an intelligent, XML-aware manner.
The XML-aware diff/merge options are completely customizable. For example, you can specify if entities should be resolved, if namespace prefixes, whitespace, CDATA, processing instructions, comments, or the ordering of attributes/child elements should be ignored or not, and how to visualize differences. In addition, you can merge the textual differences and differences in XML between files as you are comparing them.
Altova provides comprehensive support for end-to-end XBRL development and report generation, from taxonomy editing in XMLSpy, to high-performance validation on RaptorXML Server, to data mapping and analysis in MapForce, to multi-channel report generation StyleVision.
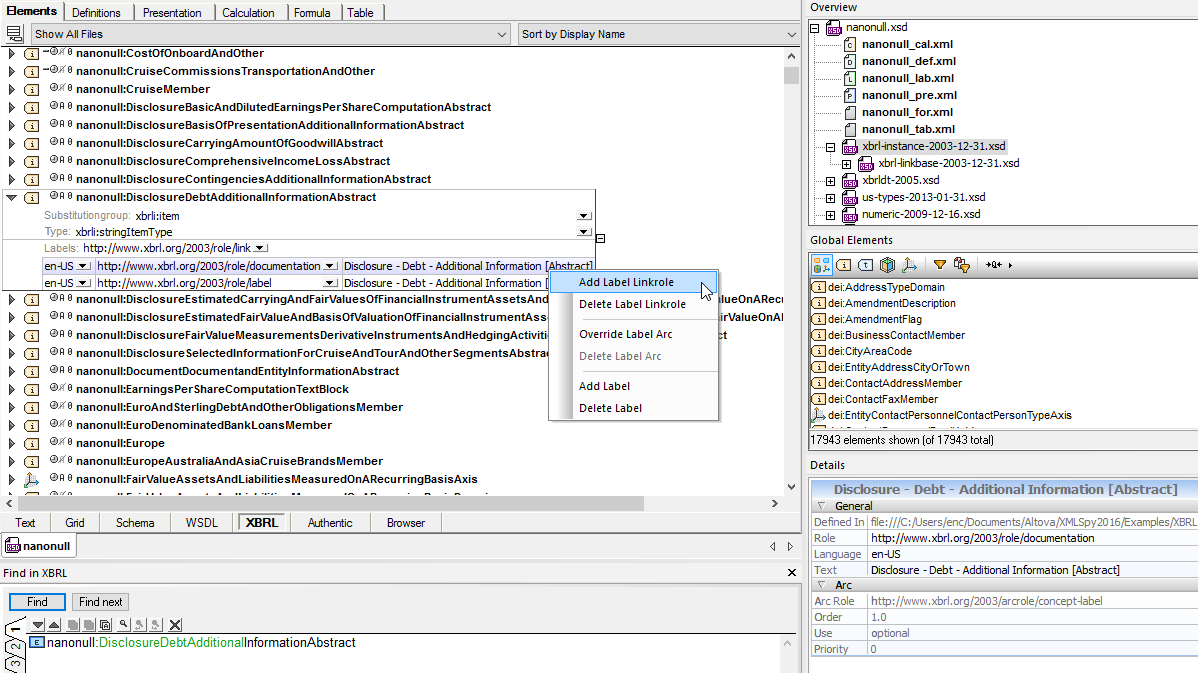
The XMLSpy XBRL taxonomy editor provides a graphical view of XBRL taxonomies and intelligent taxonomy editing features.
By organizing different components on easy-to-filter tabs and providing informative icons, mouseover messages, detail windows, and context-sensitive entry helpers, the XMLSpy XBRL taxonomy editor makes it easy to both view and understand existing taxonomies, and create new ones by way of extending industry-standard taxonomies.
It even includes the handy XBRL Taxonomy Wizard to give you a head start when extending or creating a new XBRL taxonomy.
XBRL editing features include:
The XULE processor and validator in XMLSpy processes XULE expressions against an XBRL instance document, as well as providing validation of XULE documents for correct syntax according to the XULE spec.
XMLSpy includes the industry’s first interactive XULE editor. XULE editing is supported both in Text View and a specialized XULE window, shown above. Both editing views guide users with syntax help, code completion, and other helpful features that make it easy to write and test XULE expressions. As you work, auto completion values are based both on XULE syntax and the structure of the selected XBRL taxonomy, if applicable. Learn more about the powerful XULE editor.
OIM (Open Information Model) provides a syntax-independent model for XBRL data to be transformed into other formats such as CSV and JSON. Though XBRL provides an efficient, standards-based representation of business report data, such data is often stored and/or consumed in other formats. OIM is an abstraction layer that decouples XBRL from the underlying XML syntax: this way, organizations can take advantage of the functionality of XBRL and at the same time have XBRL documents written in JSON and/or CSV.
XMLSpy is one of the very first XBRL tools to support OIM with support for validation of reports in XML, JSON, and CSV, as well as one-click conversion between those formats.
Watch this demo the XBRL Table Linkbase Editor
Watch this demo of the XBRL Formula Editor
WSDL syntax can be complex, and writing the code by hand in a text-only editor is often difficult and confusing. XMLSpy’s unique graphical approach to WSDL design simplifies WSDL development by allowing you to build your WSDL visually, with drag-and-drop functionality and full validation and editing guidance. Complete WSDL code is generated behind the scenes based on your graphical design, and you can view and edit the code in Text View at any time.
Auto-generation of comprehensive WSDL documentation is also supported.
XMLSpy offers full SOAP 1.2 and 1.1 capabilities including a SOAP client for interpreting WSDL documents, creating SOAP requests, submitting them to a Web service, and viewing the SOAP response.
The XMLSpy SOAP Debugger acts as a proxy between a Web services client and server, allowing you to inspect WSDL 1.1/2.0 files, single-step through Web services transactions sent over HTTP or HTTPS, inspect every request and response XML document, set breakpoints on SOAP functions and even define conditional breakpoints that trigger when a certain request or response contains selected data that is specified by means of an XPath query.
In this way, the SOAP Debugger helps you identify and fix errors quickly and easily.
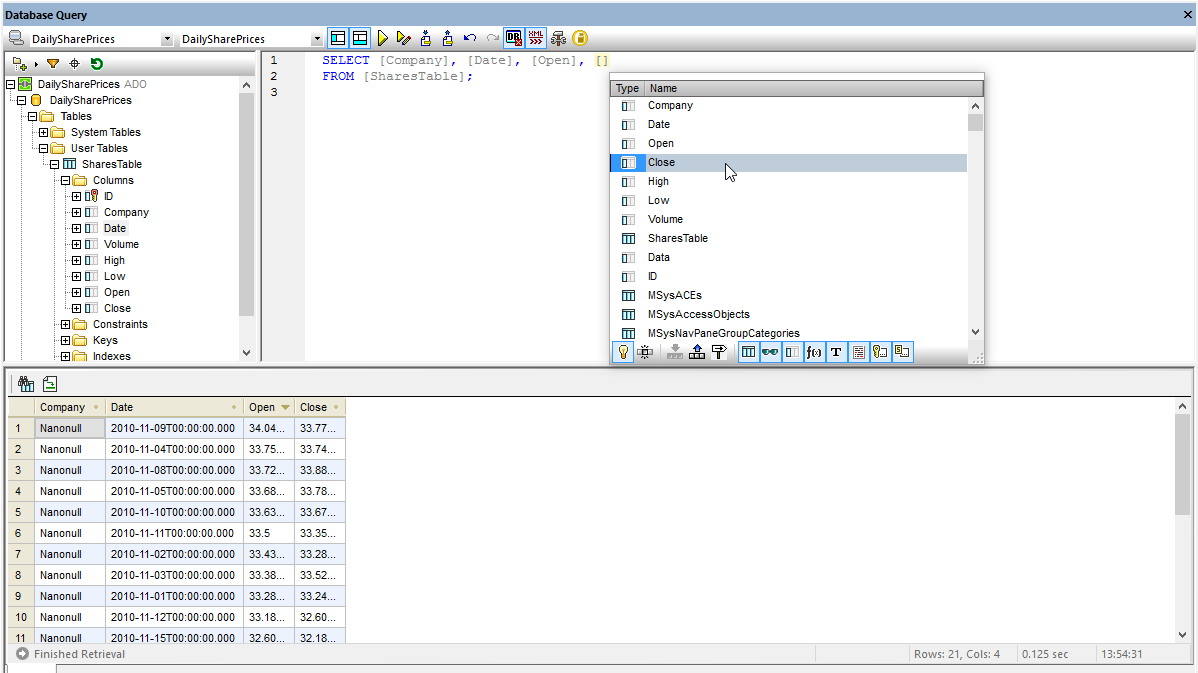
Powerful relational database integration in XMLSpy helps reduce interoperability challenges by allowing you to easily query SQL databases and convert back and forth between databases and XML files.
XMLSpy interacts with the most popular relational databases in their native interface language, including:
Database integration functionality includes:
For easy documentation during XML and JSON development, XMLSpy includes a native Markdown editor with syntax highlighting, code blocks, and an integrated Browser preview.
XMLSpy includes integrated support for working with YAML alongside XML and JSON, including a YAML editor, validator, and converter.
XMLSpy provides integrated support for accessing, editing, transforming, and querying XML data saved in Microsoft® Office documents and other zipped archives.
Why is XMLSpy the best JSON and XML IDE available? Unlike other software, XMLSpy includes numerous other advanced features for development, including:
“We have been using Altova XMLSpy for more than four years for our XSLT/XQuery/schema development... As a XSLT developer, I use XMLSpy for my XSLT development and for ALL the debugging of my code. In a nutshell, XMLSpy is the best.”
“Altova's XMLSpy is easily the fastest XML Editor I've ever seen. A free 30-day trial is available on their Web site; the only issue is that when the 30 days are up, you're going to want to buy it.”
XMLSpy fits into your development environment, whatever platform you're on:
Yes, Altova XMLSpy is an XML editor that also allows you to query and manipulate data directly from SQL databases, making it well-suited for working with XML, JSON, and relational database data together.
Some key features of Altova XMLSpy for database integration include:
Yes, there are a few XML editors that offer some level of AI integration or AI-assisted features. One example is Altova XMLSpy.
For editing JSON and XML, XMLSpy includes optional integration with Altova AI that can increase developer productivity and creativity. Altova AI can generate sample documents filled with realistic data and can generate complete XSLT and XQuery transformations. It also includes an interactive AI Assistant chat window for completing all kinds of XML and JSON development tasks.
These tools help developers of all skill levels get a head start on their XML and JSON projects.
Based on its comprehensive feature set and advanced capabilities, Altova XMLSpy is widely regarded as one of the most feature-rich and functional XML editors available in the market. Here are some key features that set it apart:
Yes, some JSON editors include a visual or graphical option for working with JSON data, making it easier to view, edit, and manipulate JSON structures compared to traditional text-based editors.
Altova XMLSpy includes a unique JSON Grid View.
JSON Grid provides a graphical representation of the JSON document structure that is easier to understand than the corresponding JSON code in text view, especially for long, complex documents with multiple nested levels of arrays and objects.
It also offers advanced features such as automatic type detection, in-cell commands, XQuery filters for modifying the view, XQuery formulas for generating additional output from the JSON data, and more. JSON Grid even allows you to create charts from JSON data.
This functionality makes JSON editing faster and easier than using a text-based editor.
With the rise of big data and the increasing volume of structured data being generated and processed, the ability to handle large file sizes is a must for an XML editor.
Altova XMLSpy includes numerous optimizations for working with very large files (XML, JSON, XSD, XBRL, Avro, etc.). You can open view huge file instantly, and the software is also optimized for hyper-fast validation of large files, especially when used in conjunction with RaptorXML Server. XSLT and XQuery execution against large files is also optimized.