XQuery Debugger

Test and Debug XQuery Expressions

  • Full-screen mode testing complex documents
  • Debugger Window to test expressions/functions
  • Support for schema-aware XQuery 1.0 and 3.1
  • Step-by-step node & instruction execution
  • Step into, step out, & step over evaluation steps
  • Support for breakpoints and tracepoints
  • Variable and call stack info windows
  • XQuery builder and tester
  • Debug XQuery execution against XML or JSON
  • XQuery back-mapping
  • XQuery Profiler

XQuery Debugger

Debug XQuery code

XMLSpy includes an XQuery debugger for testing and perfecting your XQuery code. You can work with the full-screen XQuery Debugger when analyzing results of large, complex XQuery documents against XML databases on a server, for instance, but might prefer the XQuery Debugger Window during developement of shorter XQuery expressions and functions.

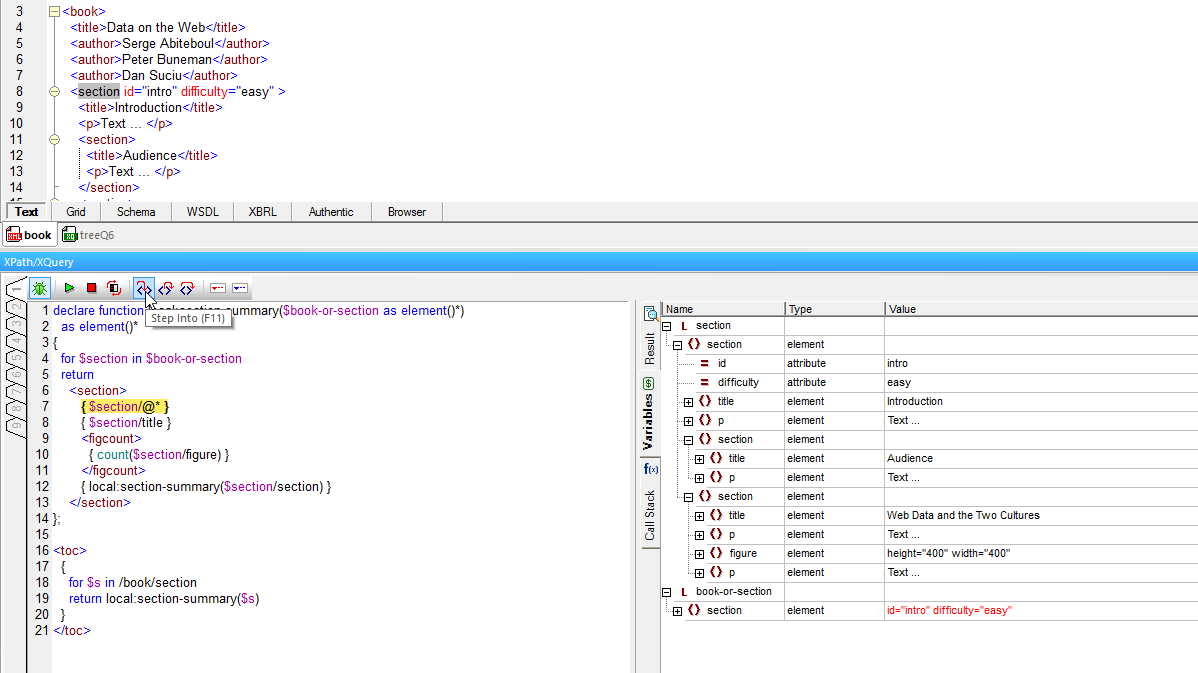
The easy-to-use debugger includes a multi-panel interface that displays the XQuery document, the source XML or JSON document (optional), and the current XQuery processor context. Below these three panels, Variable and Callstack information windows include multiple tabs that supply all the necessary debugging information.

You can to set breakpoints on any node in the instance document and any expression in the XQuery document to halt the debugger whenever a particular node or instruction is accessed. This speeds up debugging sessions since you do not have to step through each statement manually. You can also view and manage a list of currently defined breakpoints with the handy XQuery Breakpoints dialog.

When you click the Start Debugger/Go icon, the XQuery processor stops at the first breakpoint and displays the partial output relative to the context of the XQuery processor at that point in the document. The debugger highlights the current node in the XML file and the current instruction in the XQuery document, and all variables, xpath-watch values, and call stack data relevant to that point are displayed in the debugger info windows.

The ability to see the specific XML or JSON data node, the XQuery instruction, and the partial output at the same time provides you with an immediate visual understanding of the way that your XQuery document is processing the data. While the debugger is open you can make changes to your instance and/or XQuery documents at any time using the intelligent editing features of XMLSpy.

XQuery Window

XQuery debugger in XMLSpy

The XPath/XQuery Debugger Window is part of the powerful XPath/XQuery tab at the bottom of the XMLSpy interface. It's perfect for debugging shorter snippets of XQuery code for instant, interactive feedback. Because the Debugger is in the same window as the powerful XQuery editor, you can debug your code as you're building it with point-and-click expression building, enhanced entry helpers, ready-to-use code snippets, and other time-saving tools.

As you're working, you can toggle between vertical or horizontal layout of the window to accomodate the length of the XQuery code at hand.

XQuery Back-mapping

Another approach to debugging is XQuery back-mapping. Back-mapping in XMLSpy allows you to instantly see the source XML/JSON node and XQuery expression - simply by clicking a node in the XQuery output.

When you click the Enable Back-mapping button on the toolbar, XQuery executions will be carried out so that the result document can be mapped back on to the source XQuery+XML or JSON documents. When you click on a node in the result document, the XQuery instruction and the source data that generated that particular result node will be highlighted, for immediate debugging.

XQuery back-mapping saves developers significant amount of time understanding and perfecting code. And what's more, XMLSpy doesn't modify the output code at all to achieve XQuery back-mapping.

Here's How XQuery Back-mapping Works

XQuery Profiler

For further analyzing code performance, XMLSpy includes the XQuery Profiler, which monitors and records detailed metrics for each processing instruction executed, helping you identify and eliminate bottlenecks quickly.

The XQuery profiler includes options for monitoring a transformation based on call graph or hit count. When you execute an XQuery in XMLSpy, the XQuery profiler displays metrics including hit count, duration, and descendants’ duration. Clicking any element listed in the profiler window automatically opens its associated XQuery document and highlights the element, helping you track down bottlenecks with a single click.