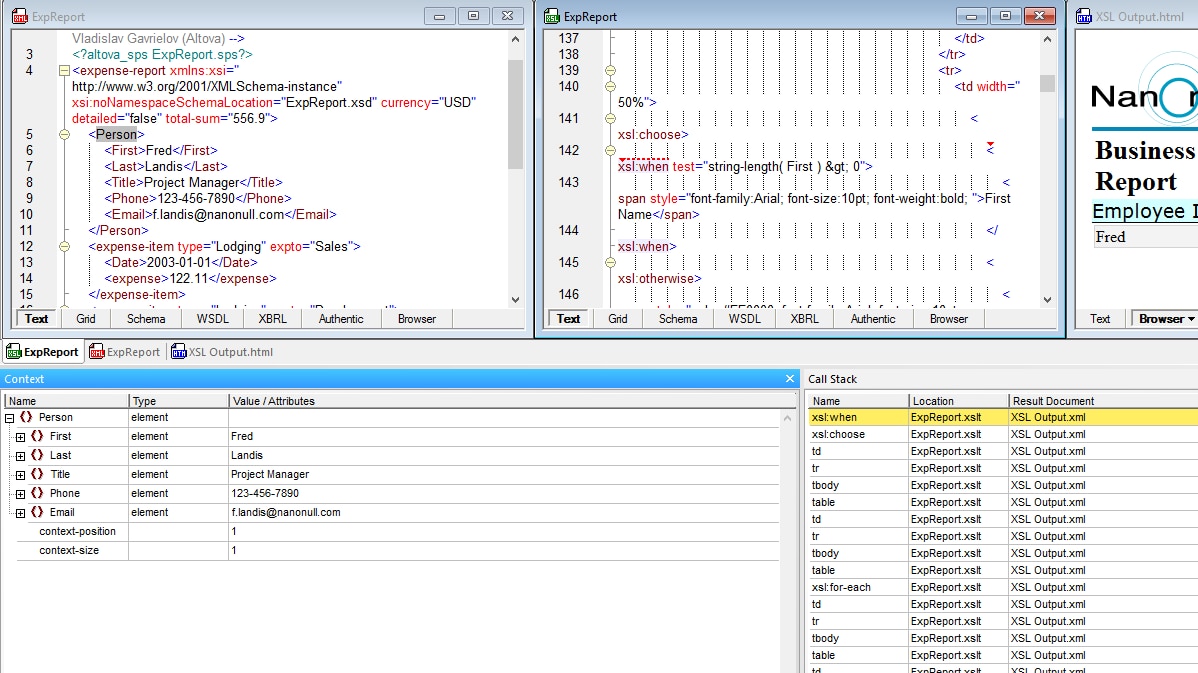
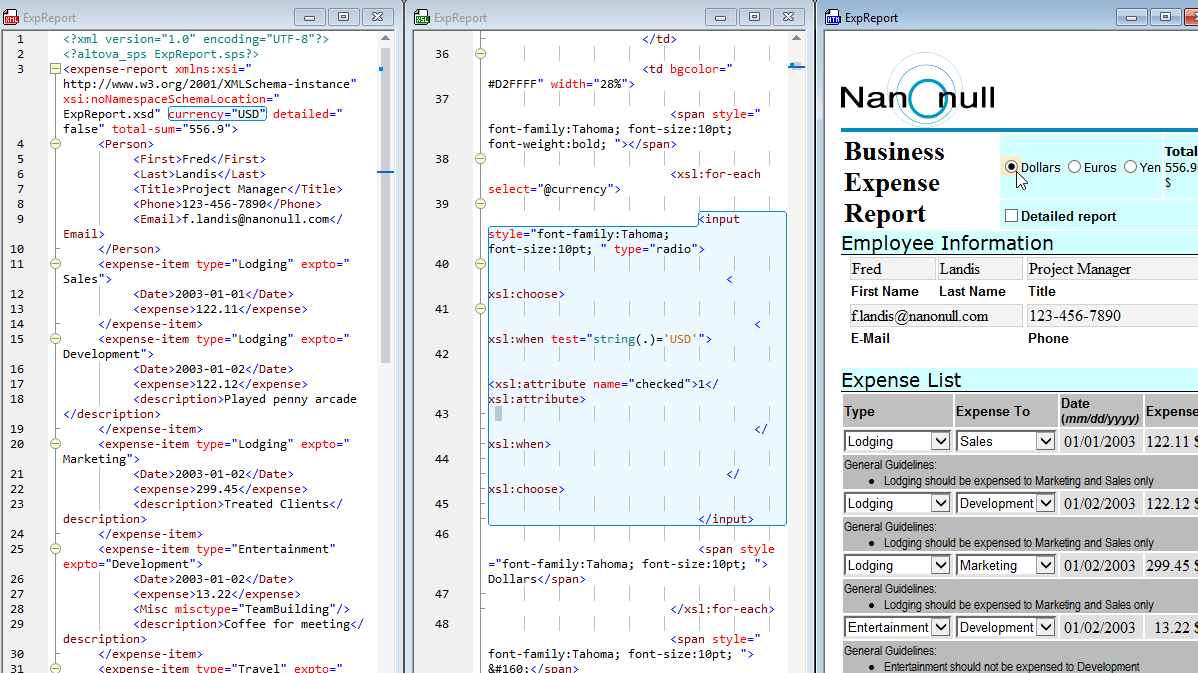
Home. 
.

transparent

transparent

transparent

XSLT Debugger

Altova XMLSpy® 2009 includes a powerful XSLT debugger for troubleshooting and perfecting XSLT 1.0 and 2.0 stylesheets.

Testing and perfecting XSLT stylesheets can be a complicated, time-consuming process. With the XMLSpy® 2009 XSLT debugger, you can step through and debug even the most intricate stylesheets quickly and easily. You can even debug stylesheets that contain program code in Java, C#, JavaScript, or VBScript.

Altova XMLSpy® 2009 includes a complete implementation of the powerful new XSLT 2.0 and XPath 2.0 specifications, and the XSLT debugger allows you to debug both XSLT 1.0 and 2.0 stylesheets. To learn more about significant technical benefits of XSLT 2.0 and XPath 2.0, visit our XSLT/XPath 2.0 page.

XSLT Debugger

The Altova XMLSpy® 2009 XSLT debugger includes a three-panel interface that displays the XML document, the associated XSLT 1.0 or 2.0 stylesheet, and the output document as it is being built in real-time. Below the three panels, Context and Callstack information windows include multiple tabs that supply all the necessary debugging information.


XSLT Debugger

Demo of building XSLT debugger View a Flash demo of the XMLSpy XSLT debugger now

Depending on the complexity of your XSLT stylesheet and your personal preferences, he XSLT debugger allows you to debug XML and XSLT files in Advanced Text View or Grid View, and view the dynamic output in Advanced Text, Grid, and Browser View, switching between the different views as required.

XSLT Debugger

You can start the XSLT debugger at any time when working with an XML or XSLT 1.0/2.0 file. If a permanent XML / XSLT file designation has not been specified, XMLSpy® 2009 will prompt you to select the associated file.

The XML and XSLT files are opened side-by-side next to the output panel, which displays the output file defined by the XSLT stylesheet.

The XSLT debugger allows you to move through the XSLT transformation step-by-step, and you can step into, step out, and step over nodes. The XSLT debugger highlights the current XSLT instruction in the XSLT stylesheet and the current node in the XML file, and produces output for each step, which is highlighted in the output pane. The ability to see the specific XML data node, the XSLT processing instruction, and the produced output at the same time provides you with an immediate visual understanding of the way that your XSLT stylesheet is rendering the XML data.

Breakpoints and Tracepoints

When debugging complex XSLT 1.0 or 2.0 stylesheets, it is useful to be able to understand exactly what output is produced by each instruction. In the XSLT debugger, you can define breakpoints in the XML and XSLT files, and tracepoints in the XSLT document.

Breakpoints halt the XSLT debugger when a particular node is accessed by an XSLT instruction, allowing you to view the output to that particular point in the transformation. Using the XMLSpy XSLT debugger, you’re not restricted to line-by-line breakpoints – you can set breakpoints on any number of individual nodes, attributes, and elements. The ability to set breakpoints on nodes in the XML data file provides you with the ability to halt the XSLT debugger whenever that particular node is accessed by any XSLT instruction, e.g., during the execution of an xsl:for-each loop.

When you click the Start Debugger/Go icon, the XSLT processor stops at the first breakpoint and displays all data relevant to the node in the debugger info windows.


XSLT debugger breakpoints

In contrast to breakpoints, tracepoints do not halt the XSLT debugger. When a tracepoint is hit during an XSLT debugging session, the instruction is executed, and information is written to the Trace window. Once the transformation is complete, the trace window displays the list of tracepoints as well as the output produced by each. This allows you to view exactly how each XSLT instruction is executed.


XSLT debugger tracepoints

You can also set an XPath for a tracepoint. In this case, the result of the XPath statement is displayed in the trace window.

You can insert/remove and enable/disable breakpoints and tracepoints using the XSLT debugger toolbar, keyboard shortcuts, or via a context-sensitive right-click menu.


Setting XSLT debugger breakpoints and tracepoints

The XSLT Breakpoints / Tracepoints dialog also allows you to edit and remove breakpoints and tracepoints.


XSLT debugger breakpoints dialog

Breakpoints and tracepoints give you two different ways to see exactly what output is being produced by each instruction in your XSLT file, allowing you to troubleshoot and edit your files efficiently.

Perfecting XSLT Stylesheets

As you’re debugging a stylesheet, the XSLT debugger presents you with several useful pieces of information. To supplement the information shown in the output pane and Trace window, the debugging information windows display additional important details.

The Context information window includes the following tabs:

  • Context: displays the context node and associated attributes or value(s).
  • Variables: displays the global, local, and parameter based variables as well as the name and variable value.
  • XPath Watch: displays the result of XPath 1.0/2.0 expressions, which are evaluated against the root or context node, depending on how they are entered. You can define the XPath expressions you want to monitor here.

Tabs in the Call Stack info window include:

  • Call Stack: displays a list of the previously processed XSL instructions and templates, with the current instruction appearing at the top of the list.
  • Templates: displays all templates used while debugging the current XSLT file. This includes the provided default templates in the built-in template, as well as any included or imported templates.
  • Info: displays information about the type of debugging (XSLT 1.0 or 2.0), the files used, and the debugger status.
  • Messages: displays the xsl:message instruction(s) or any error messages that may occur during debugging.
  • Trace: displays output information for each tracepoint.

As you are debugging an XSLT 1.0 or 2.0 stylesheet, you can view and change variables in the XML and XSLT files using the intelligent editing features of XMLSpy® 2009, which include syntax coloring, context-sensitive entry helpers, tag code completion, automatic cursor positioning, and more.

The XSLT debugger uses the award-winning XMLSpy XSLT processor.

In addition to the built-in XSLT debugger, intelligent XPath auto-completion and the XPath 1.0 / 2.0 analyzer facilitate the testing and debugging of XPath 1.0 and 2.0 expressions in XSLT stylesheets, XQuery documents, and XML Schema identity constraints.

The XSLT profiler helps you further optimize your stylesheets.

Experience the power of the XSLT debugger for perfecting your XSLT stylesheets - Download a free 30-day trial of XMLSpy.


transparent
Download
Pricelist
Buy
Video
Comparison
Datasheet
Print
Mail
Digg
delicious
Free Processor
.

AltovaXMLAltovaXML is a an XML standards processor that includes the Altova XSLT 1.0, XSLT 2.0, XQuery, and XML validation engines for royalty-free use in your custom applications.

.
XMLSpy Available
in German
.

Altova XMLSpy is now available in English and German versions from our download page.

.
.
.
XSLT Debugger Video Presentation!
.

NEWSee an online video presentation of the XMLSpy XSLT Debugger in action! Exterminate unwanted XSLT bugs with the new XMLSpy® 2009 XSLT Debugger - a simple and easy-to-use tool for building quality, bug-free XML applications

.
XPath Analyzer
.

NEW XMLSpy® 2009 contains a new XPath Analyzer that assists you in building and verifying XSLT expressions, which are used to select XML elements during the XSL transformation process.

.
more XPath features...more

.
.

transparent

transparent