Altova StyleVision is a graphical report builder for XML, XBRL, and database data.
Your single, drag-and-drop report design lets you publish data in HTML, PDF, Word, text, and eForms simultaneously. Automate your multi-channel publishing via auto-generated XSLT stylesheets or StyleVision Server!
Altova StyleVision is a graphical report builder for XML, XBRL, and database data.
Your single, drag-and-drop report design lets you publish data in HTML, PDF, Word, text, and eForms simultaneously. Automate your multi-channel publishing via auto-generated XSLT stylesheets or StyleVision Server!
“Altova StyleVision is essential to helping us deliver content in a wide variety of formats at our university’s training center. There’s so much you can do with StyleVision. It has everything I want and more.”
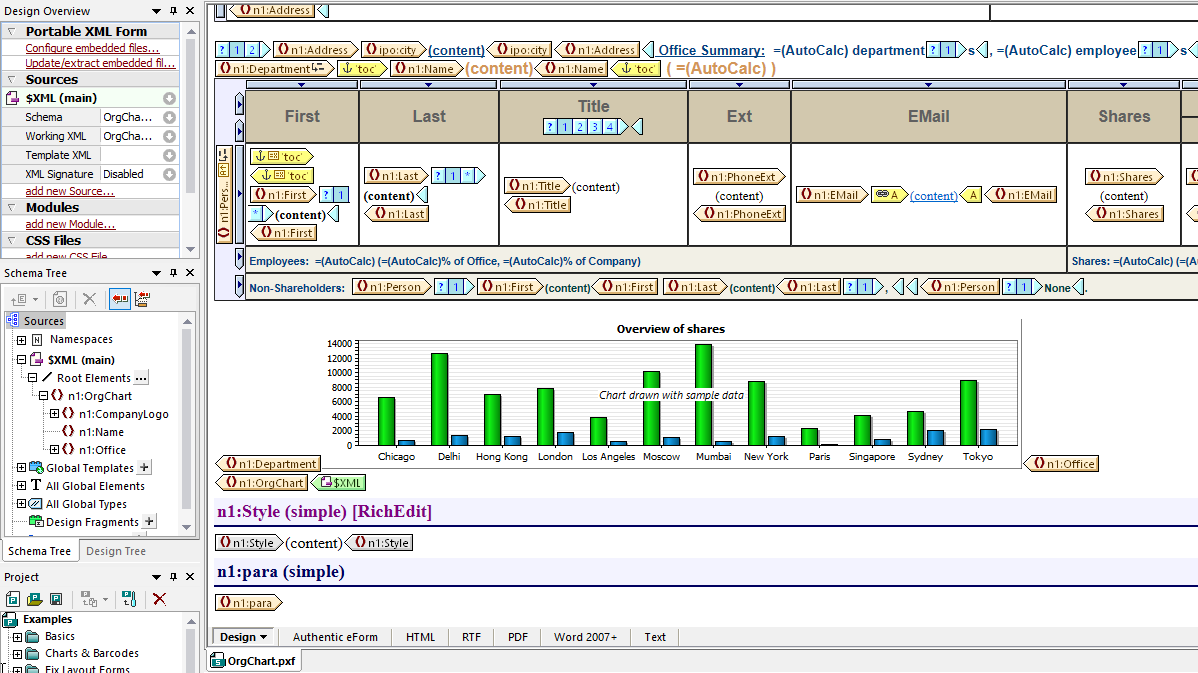
StyleVision takes the complexity out of XSLT coding by allowing you to build reports and forms visually. You simply drag and drop to create sophisticated designs for publishing XML, XBRL, or database data in multi-channel formats.
Designing XSLT stylesheets for report generation in StyleVision is a highly flexible, visual drag-and-drop process facilitated by intelligent menus and entry helper windows. Advanced stylesheet functions help you define conditional templates, auto-calculations, rich input formatting, and more.
The StyleVision report designer includes:
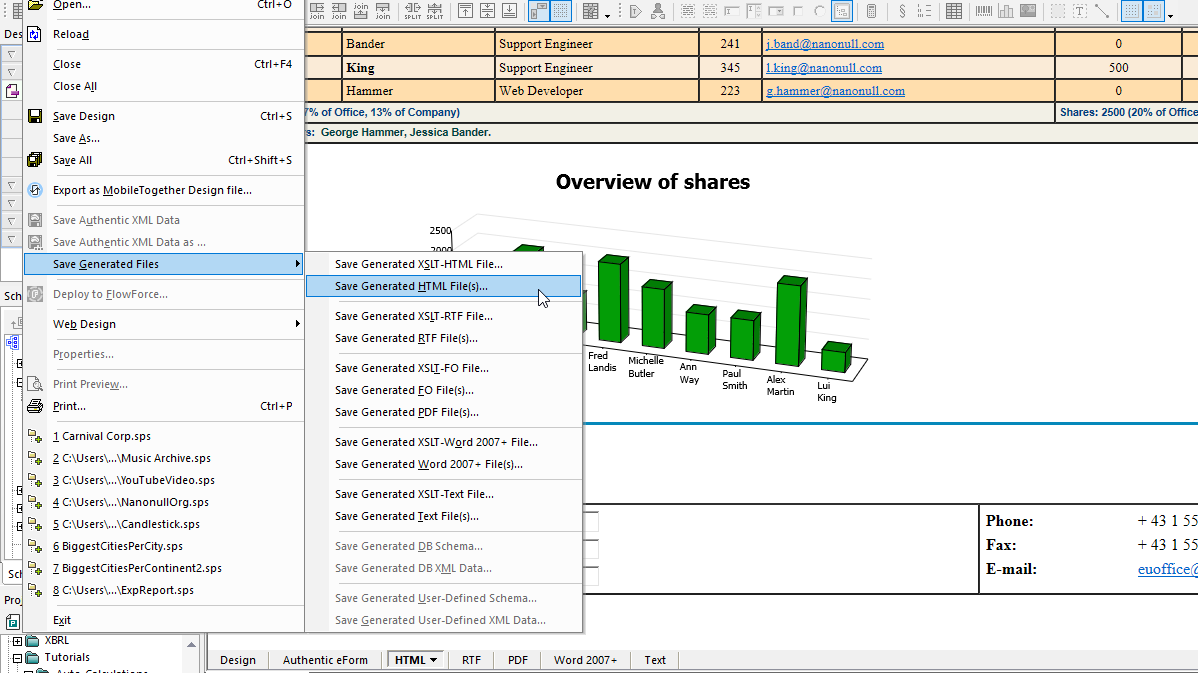
Each report you build in StyleVision automatically generates output in HTML, PDF, Word, RTF, and pure text, as well as the corresponding XSLT or XSL:FO stylesheet for each format.
It’s easy to get started in StyleVision. You can even base your design on an existing Word document – this is infinitely easier than hand-coding XSLT!
StyleVision is ideal for designing multi-channel or multi-format publishing of business reports. Whether you need to publish XML, database, or XBRL data – or a combination thereof, it’s easy to design sophisticated reports using StyleVision’s drag-and-drop design paradigm.
Your one design simultaneously creates a compelling business report in Web and print ready formats including HTML, PDF, RTF, Word, and text.
You can automate your multi-channel report publishing projects using the generated XSL stylesheets or via the high-performance StyleVision Server.
StyleVision makes it easy to transform XML content into reports that address business goals. Each design you create in the StyleVision XML publisher generates your XML report in multiple channels for print and the Web. The corresponding XSLT and XSL:FO stylesheets are also generated for easy automation.
Since PDF documents are paginated, StyleVision includes special XSL:FO options including bookmarks, tables of contents, cover page design options, headers and footers, and so on.
Use StyleVision to publish:
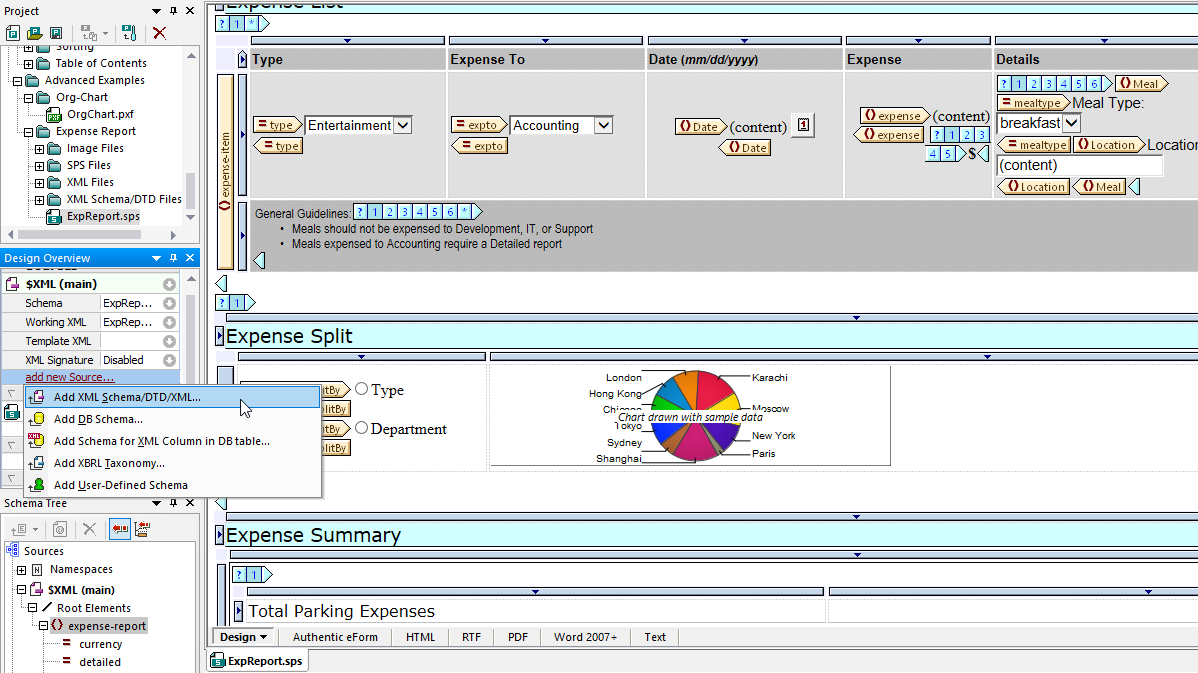
Combine data from multiple XML Schemas or DTDs in a single report design, or add other sources such as relational database or XBRL files. StyleVision makes it easy with a visual design paradigm, intelligent entry helpers, conditional templates, and more.
As with XML reports, it’s easy to publish database reports in HTML, PDF, Word, and text formats based on a single StyleVision design.
All major relational databases are supported in a single product version.
Database report building functionality includes:
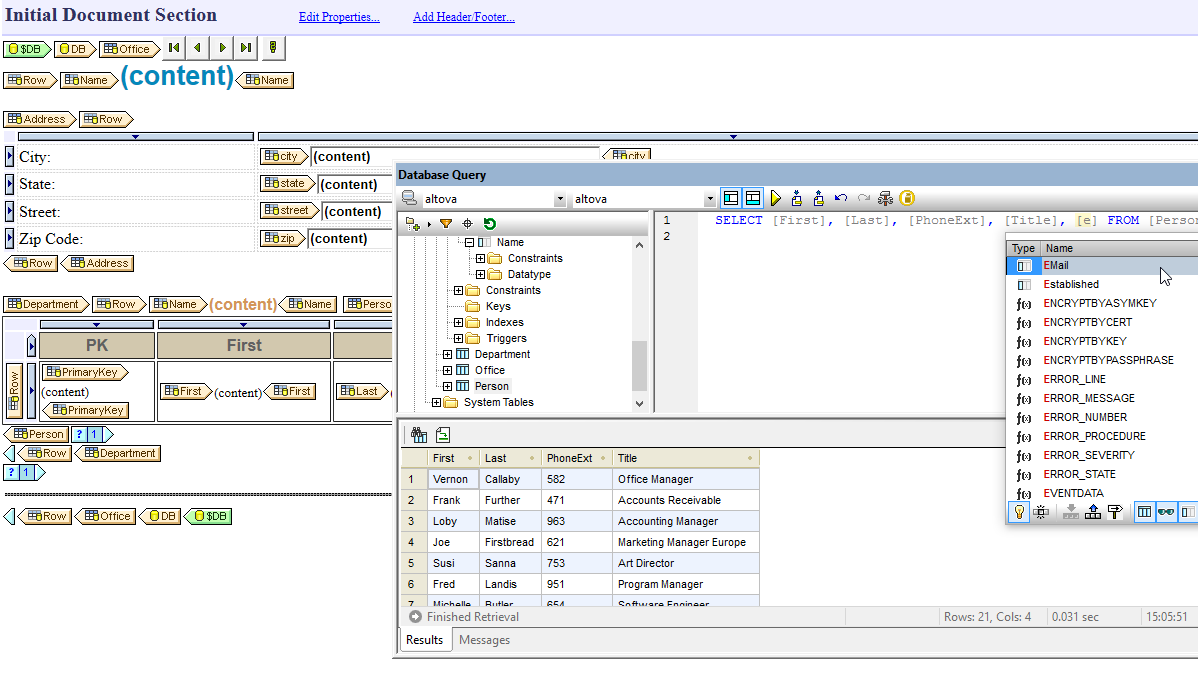
It’s easy to connect to back end data using the Database Connection Wizard, which includes ADO, ODBC, or JDBC options. Once connected, the StyleVision presents you with a list of the available views, tables, and system tables, and the Preview Window lets you to see the data while you're selecting the tables and views to use in your database reporting design.
As you're designing a database report, it is useful to view the content of the database you're connected to. The StyleVision Database Query window provides an intelligent SQL editor with auto-completion. You can also let StyleVision autogenerate SQL statements by dragging database objects from the browser pane onto the SQL editor or selecting them using the right-click menu. Alternatively, you may import and edit existing SQL scripts.
To create your design, simply drag and drop elements to the desired location on the design pane. Advanced database reporting features like grouping based on the XSLT 2.0 standard, inline Primary and Foreign key creation, and support for Database Views enable you to add complexity and dynamic functionality to your multi-channel reports.
An important way to harness the benefits of XBRL is rendering reports in print and web formats for various stakeholders. StyleVision’s visual design model radically simplifies XBRL-related rendering, reporting, and analysis, making it possible for business domain experts without deep XML expertise to leverage the full power of XBRL.
Specialized functionality for publishing XBRL reports includes:
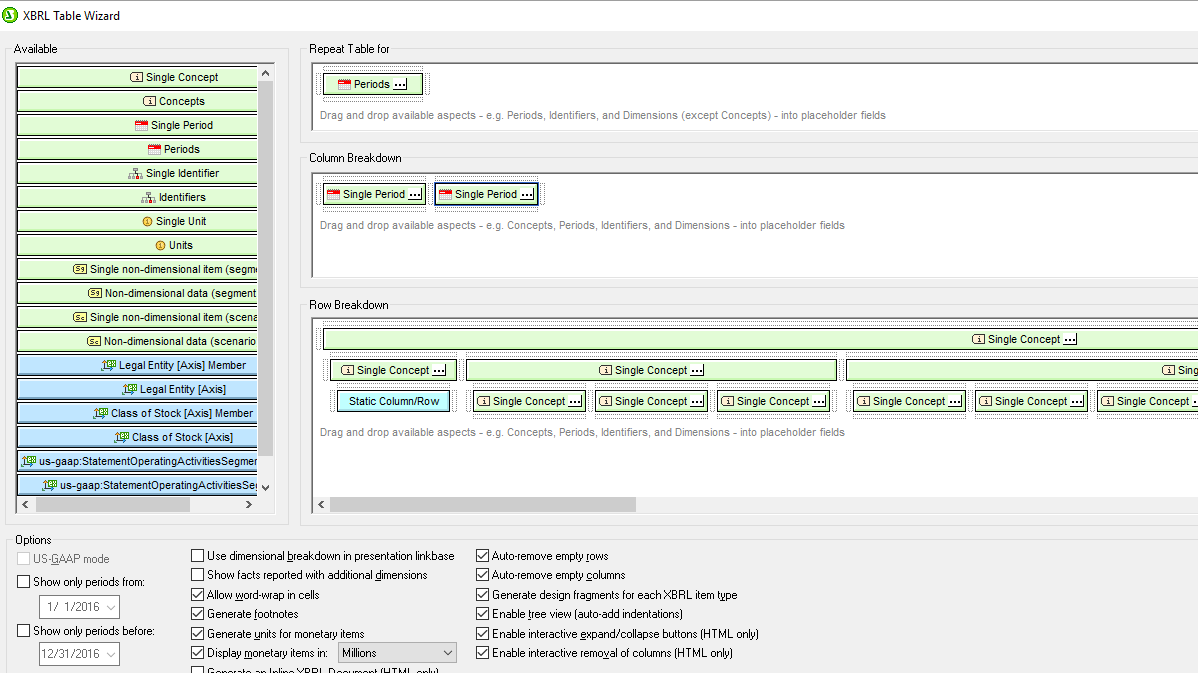
To create a straightforward XBRL report, you simply drag and drop a taxonomy financial statement onto the design pane as an XBRL table. The XBRL Table Wizard makes it easy to customize the table structure and specify the concepts to include in the report. In the case of the US-GAAP taxonomy, you can simply select US-GAAP mode to have StyleVision automatically render the data according to this information.
When your taxonomy contains XBRL Table Linkbase definitions, StyleVision will render the table automatically based on the specified parameters, making it quick and easy to publish XBRL tables in your reports.
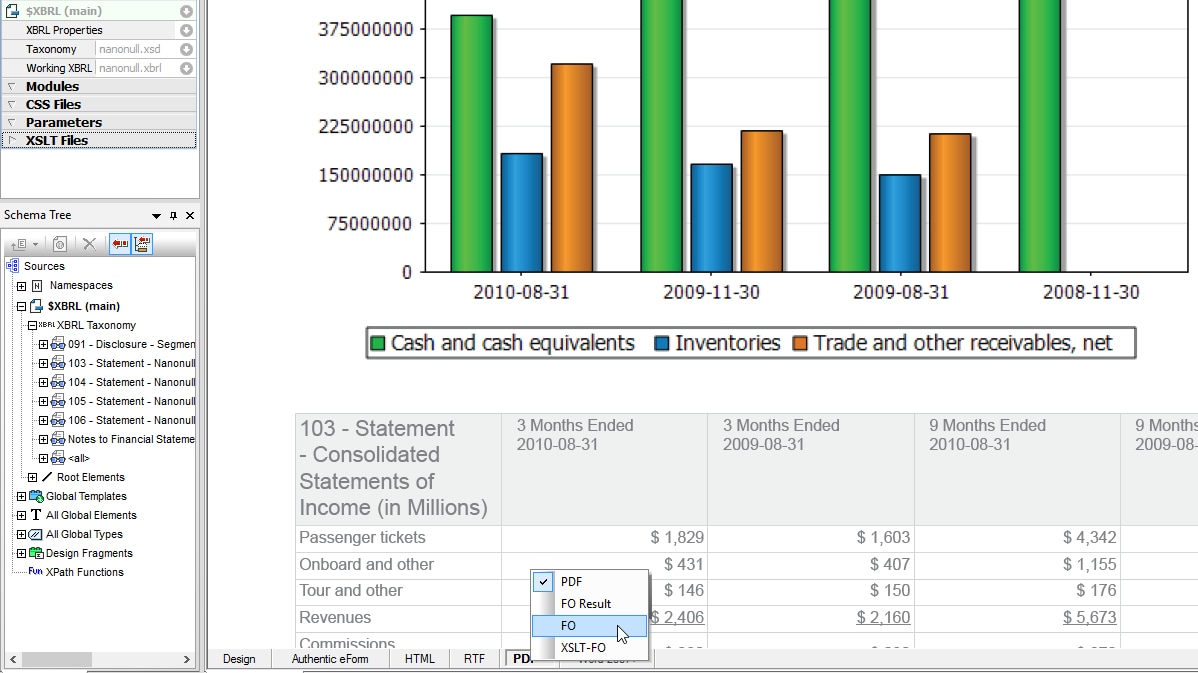
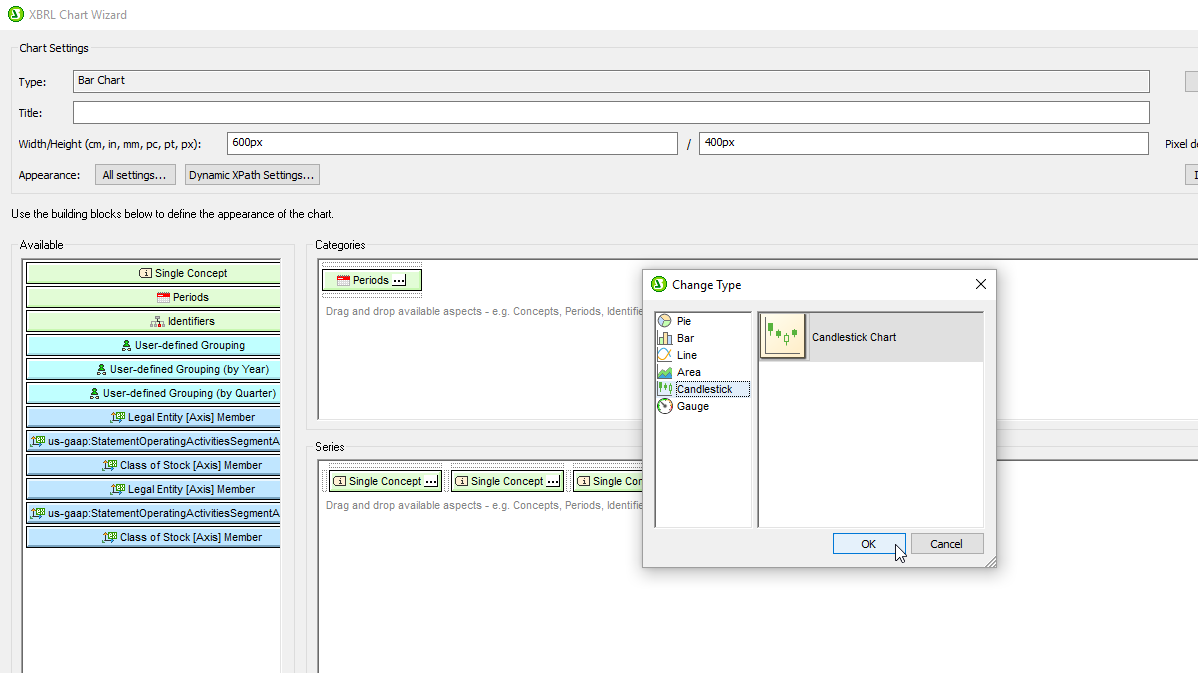
Similarly, StyleVision provides a wizard for automatically generating charts of XBRL data in your reports. You can customize the data rendered in your charts simply by selecting the desired category or series values (Concept and Period are the defaults) in the properties dialog box. The Period Properties dialog box allows you to filter by XBRL periods, which simply describe the length of time for which a particular concept is being reported (i.e., instant, duration, or forever), so that you can make meaningful comparisons.
Because iXBRL embeds XBRL in a human-readable HTML document, it’s an efficient means of decreasing the complexity of preparing and publishing financial reports while enabling the use of XBRL data by investors and other market participants.
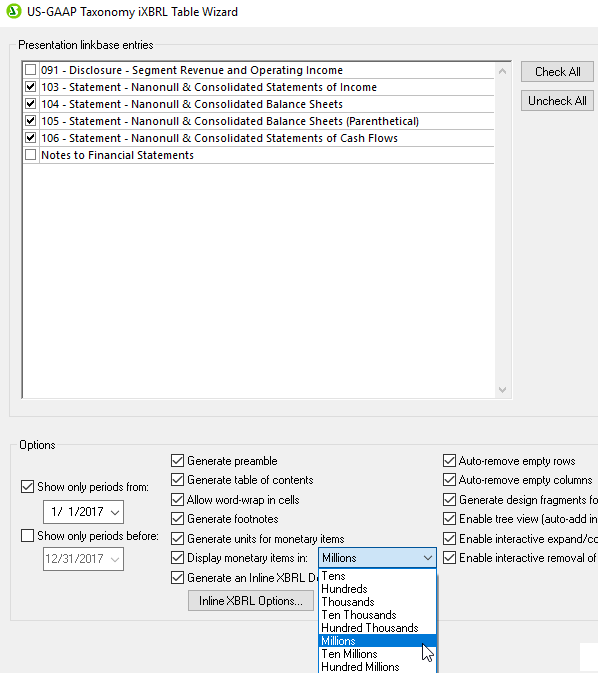
To make rendering this output even easier, StyleVision includes an iXBRL Wizard for US-GAAP taxonomies that will automatically generate an iXBRL document based on definitions in the presentation linkbase.
When you load a US-GAAP taxonomy as a data source in StyleVision, the iXBRL Wizard will allows you to select which tables to create and to configure other options. Then, it will autogenerate the corresponding iXBRL document.
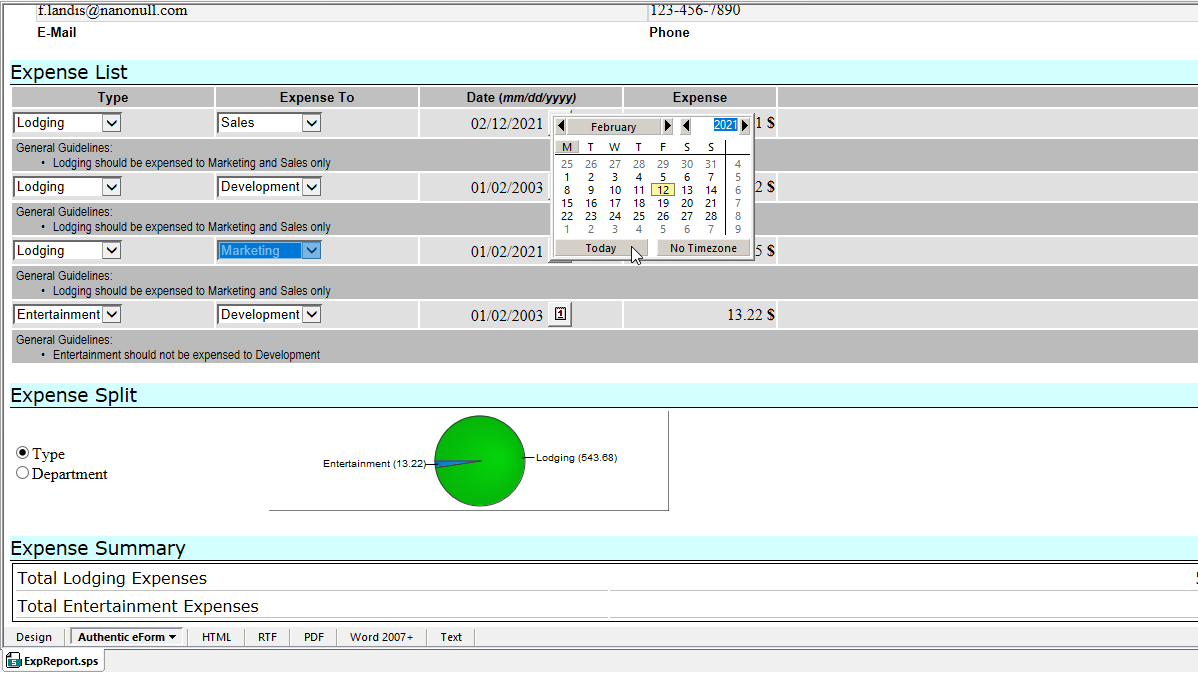
For solutions requiring interactive electronic forms based on XML documents and/or SQL databases (including XML documents stored in leading relational database management systems), StyleVision’s visual design capabilities can be used to create dynamic and interactive enterprise forms for Authentic. In fact, each design you create for web and print output also automatically generates and Authentic form.
You can begin an e-Form design from scratch, or from an existing Word document, or based on the blueprint of an existing paper-based form. Form designers work with the same visually-oriented, drag-and-drop approach used when creating StyleVision reports, so Authentic forms can be considered one of the many StyleVision output format types, but form designs also offer many additional features optimized for interactive and dynamic enterprise forms.
Authentic e-Form Advantages:
StyleVision includes numerous advanced features for stylesheet, report, and eForm design:
StyleVision Server is high-performance server software that takes advantage of the power of today's parallel computing environments to automate multi-channel business report publishing.
“Altova lets me define an XML model and then lets my non-technical team create XML all without ever having to look at the code. StyleVision and Authentic are in use in our office every day.”
“StyleVision is well-engineered to let you display data the way you'd like it… If you're looking for a flexible way to deal with XML data, this is one good place to look.”
One example of an affordable database reporting tool is Altova StyleVision. StyleVision can connect to SQL databases to generate stylesheets for database reporting. It allows users to design templates for extracting data from databases and formatting it according to specific styling and layout requirements.
StyleVision has a visual, drag-and-drop report design interface and easy-to-use table and chart wizards. And, since it supports 15 of the most popular SQL databases, users do not have to pay extra to support multiple database types. Once a report design is created, Altova offers affordable automation via StyleVision Server.
XSLT is a standard XML-based language used for transforming XML documents into other formats, such as HTML, PDF, and Word. You can create XSLT stylesheets to define the transformation rules for converting XML content into these formats.
Even if you don’t know the intricacies of the XSLT language, you can take advantage of a visual tool like Altova StyleVision. This software lets you design stylesheets using a graphical, drag-and-drop approach. You simply create a design based on your source XSD, and StyleVision automatically generates stylesheets and the corresponding output rendered in HTML, Word, and PDF. It also generates text and RTF output.
XBRL is a standard markup language used for financial reporting and data exchange. One popular tool that is commonly used for rendering XBRL reports is Altova StyleVision. It is a visual report designer that lets users render XBRL data in web and print formats like HTML, PDF, and Word.
StyleVision’s visual design model simplifies XBRL-related reporting and analysis with an XBRL Chart Wizard and XBRL Table Wizard. Once a report design is created, you can use it to generate reports on a recurrent basis in StyleVision or in an automated fashion using StyleVision Server.
For companies submitting financials in iXBRL format, StyleVision includes an iXBRL Wizard for automatic generation of iXBRL documents from US-GAAP taxonomies based on definitions in the presentation linkbase.