Altova DatabaseSpy is the unique multi-database query and design tool that even generates elegant charts directly from query results.
DatabaseSpy connects to all major databases, easing SQL editing, database structure design, content editing, and database conversion for a fraction of the cost of single-database solutions.
New! Altova AI, additional speed increases, and more new features in Version 2026r2 available May 27, 2026.
The versatile DatabaseSpy SQL Editor is divided into a SQL statement window and one or more tabbed or stacked Result windows, with a convenient Execute button in the SQL Editor toolbar to let you immediately execute your SQL statements and view the output.
The SQL statement window applies color coding to each SQL statement with unique identification for SQL statements, parameters, operators, and comments to help you quickly and easily review and analyze an individual SQL query or a complex series of SQL commands.
The DatabaseSpy SQL editor features customizable SQL auto-completion to accelerate SQL query development. Execute queries and see immediate results in one or more windows that may be tabbed or stacked.
Supported Databases:
SQL formatting configurations are provided for each supported database and appropriate formatting is automatically applied when you switch databases.
DatabaseSpy supports asynchronous query execution, allowing multiple SQL queries to be processed in different windows at the same time, either queries to different servers or even multiple queries against the same server.
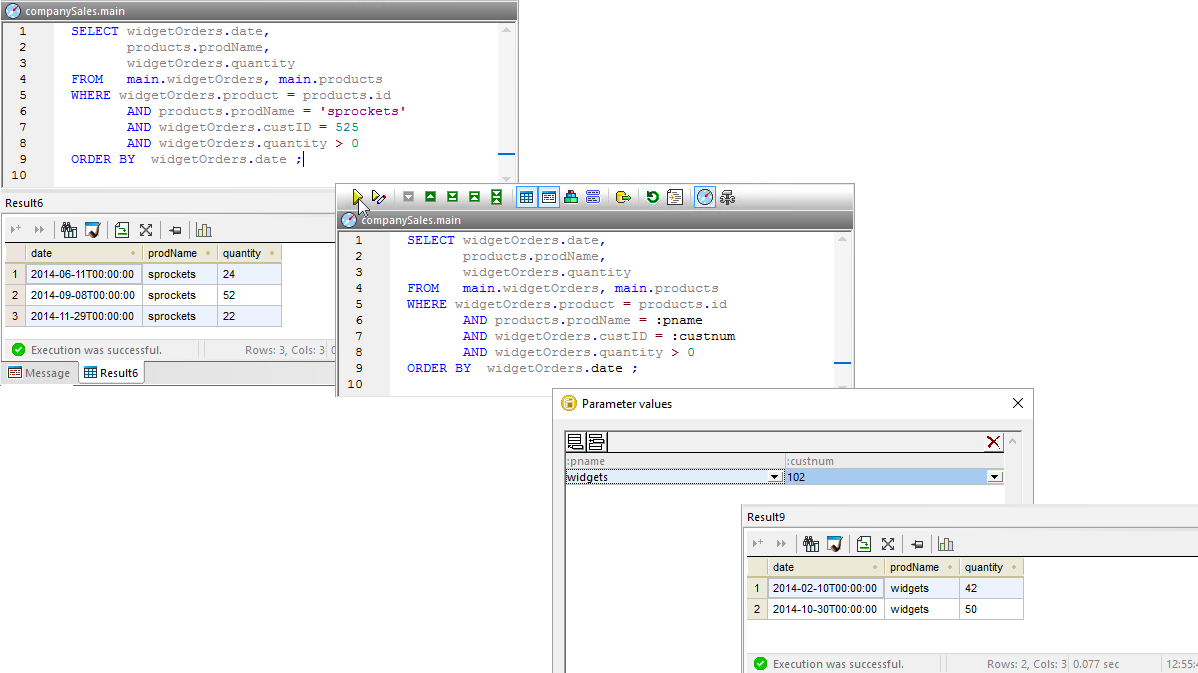
DatabaseSpy includes support for SQL queries that contain parameters, also known as SQL Templates. Parameters can make a query much more flexible, for instance allowing users to easily test complex join statements with multiple values.
The DatabaseSpy SQL Editor and result windows at the top left below show a query to report all orders of a specific product by a specific customer.
This query could be much more flexible by replacing the product name ‘sprockets’ and the customer number 525 with parameters, as shown in the second query window above where the parameters :pname and :custnum are substituted for the product and customer.
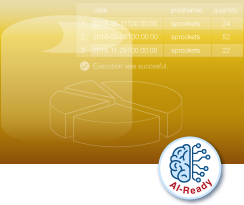
When the query with parameters is run directly using the Execute button at the top left of the SQL Editor window, DatabaseSpy opens a dialog allowing the user to enter values for execution, and the result shown at the lower right is generated.
SQL Templates for DatabaseSpy can be saved in a special projects folder and executed dynamically. Often a user needs to create queries that generate test results to explore unfamiliar data. After a test query is executed, the user can select values from the result table and supply them as parameters to a SQL template stored in the project templates folder.
A new SQL Editor window opens with an automatically-generated query based on the template with selected values assigned to the parameters, the generated query is executed, and the result table is shown.
It's easy to access AI functionality directly in the SQL editor using the DatabaseSpy AI Assistant for creating sample SQL statements and data, creating relationships between tables with no current keys, and so on. DatabaseSpy also includes powerful extensions in the SQL Editor menu that are powered by Altova AI:
AI integration is a great tool to increase productivity and accelerate learning when working with relational databases.
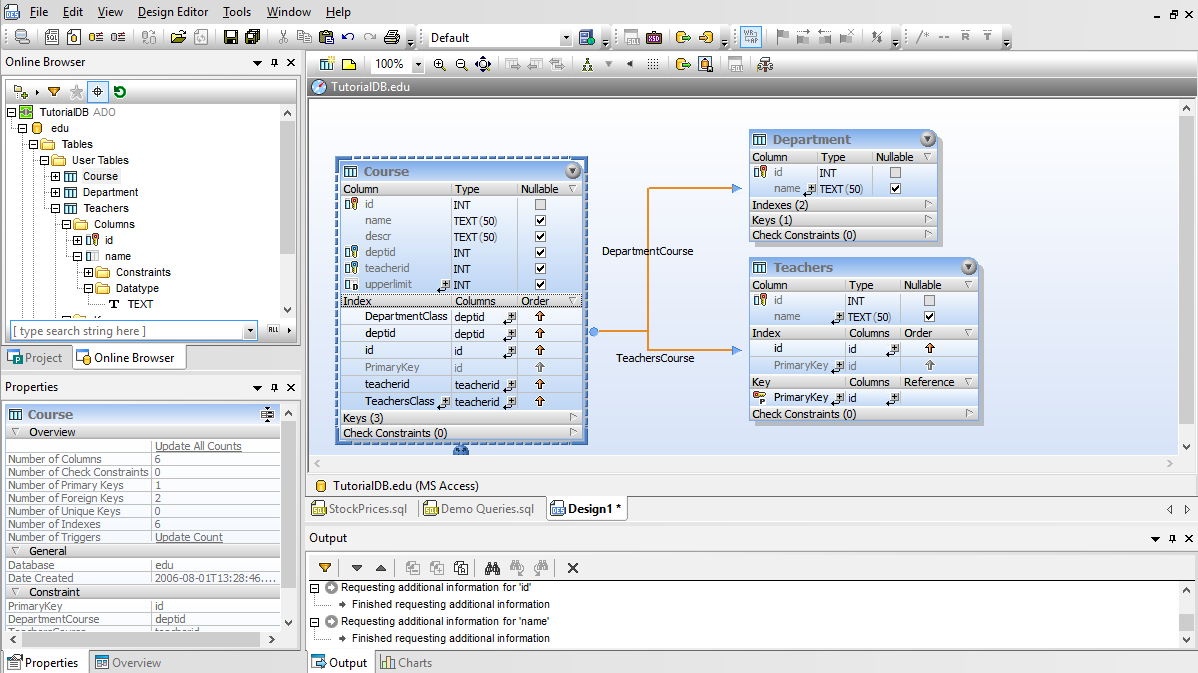
The graphical design editor in DatabaseSpy lets you view and edit the structures of all your databases through one graphical user interface. You can examine tables and relationships in an existing database, edit tables to better suit your needs, or even can add entire tables and specify all their column attributes and relationships to other tables from scratch.
The DatabaseSpy graphical view lets you concentrate on the underlying structure of your data and any required modifications rather than the SQL commands required to implement them. As you work, the DatabaseSpy graphical database designer automatically constructs the SQL statements you will need, but you choose when to execute the database structure change script once all your edits are complete.
DatabaseSpy includes a command to create complete DDL scripts for a database schema. When a database administrator needs to recreate a complete database structure, scripts are required not just to create tables, but also all views, constraints, indexes, functions, procedures, etc. that may be defined in the database.
Right-clicking any database schema in the Online Browser helper window offers the DDL Script command.
The script is then immediately opened for review in a new SQL Editor window.
DDL Scripts are essential for backing up complete database structures, or to move a structure to a different server when the actual table contents are not required, such as moving from a development environment into production.
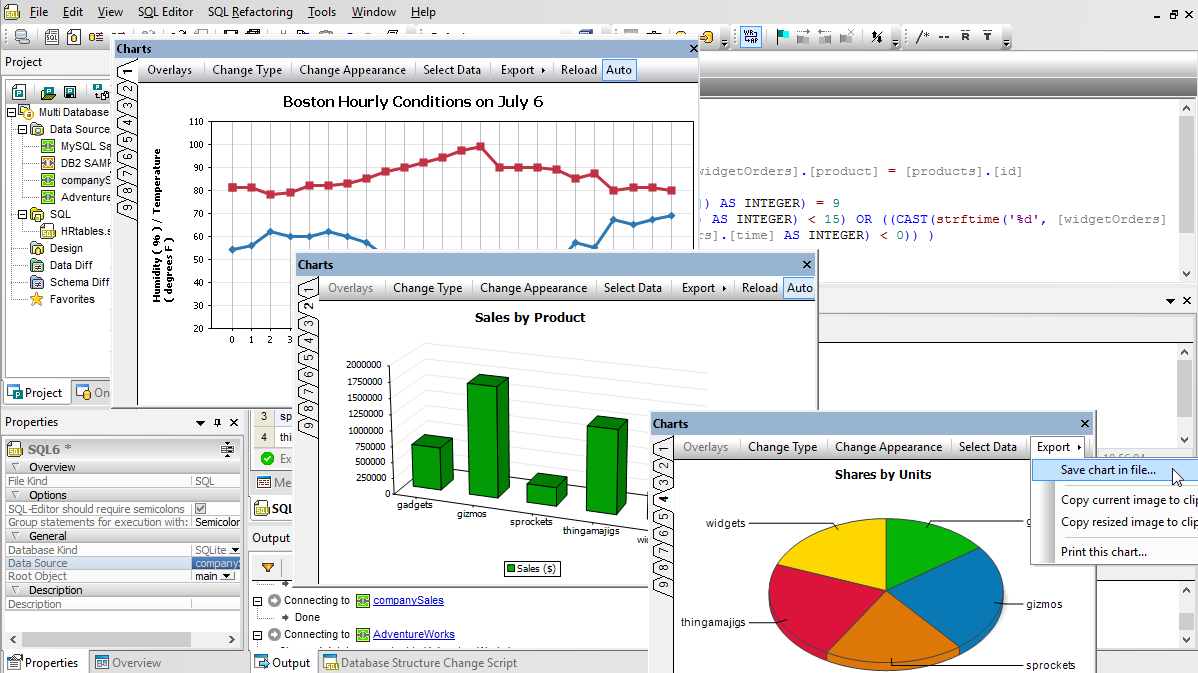
A colorful, eye-catching chart is much more vivid and communicates meaning more effectively than a table of numeric data. DatabaseSpy provides a wide variety of charting features for visualization of SQL query results. Create the most accurate and vivid graphical representation of your data in line charts, bar charts, pie charts, area charts, and many more with advanced formatting options.
Now you can create attractive and informative charts data visualization of information in your database without exporting data to a dedicated charting application. Charts created using DatabaseSpy are customizable to suit business intelligence reports in HTML, Microsoft Word, RTF, or PDF documents, or you can save charts created in DatabaseSpy in your choice of .png, .bmp, .gif, or .jpg image formats at the custom resolution you specify.
Numerous customization options are available for each chart type, including chart titles, foreground and background colors, definition of axis ranges and labels, control of fonts, text colors, fonts and sizes, and more. Intuitive dialogs let you specify every element of a chart, even the tilt angle for 3D pie charts.
Information stored in relational databases is rarely static. Existing records are updated or removed, and new information is added to keep the database up to date and accurate, maintaining business value. DatabaseSpy offers convenient database editor tools for database table content. DatabaseSpy lets you edit the content of database tables in an interactive preview window.
As you work, the database editor interacts with the database in a limited manner. When all your changes are complete, you can review your edits and commit them all at once via the Commit button on the toolbar.
In addition to editing data stored in the database, you can learn more about information presented in any DatabaseSpy results table. You can select a range of cells and copy them to paste into another application, print the results table, or automatically calculate and display information about selected results. You can also sort the results by any column to display the table data in a more useful form.
Working with Binary Data
DatabaseSpy helps you easily process binary data in a column defined as a binary data type. You can load binary data into the table from an external file, or save binary data from the database to an external file. Binary data fields supported include BLOB, raw, binary, varbinary, image, and others, depending on the database type.
Altova DatabaseSpy includes special features to explore, manage, and work with XML in databases. XML is established as the preferred method for exchanging structured data between enterprises, but storing XML data in a relational database adds a layer of complexity. DatabaseSpy includes robust tools to help you analyze and manipulate databases that contain XML information.
DatabaseSpy Features for XML:
When you expand a database table using the DatabaseSpy Online Browser, columns containing XML data are identified in the Browser Tree. You can also explore XML Schemas registered in the database in the browser hierarchy. To examine any XML Schema in detail, you can send it to XMLSpy,, the industry-leading development environment for all XML-related technologies, where it is automatically opened in XMLSpy Schema View for intuitive graphical display.
The DatabaseSpy Data Inspector Window is a helpful option to display long XML entries contained in individual cells. The Data Inspector Window displays XML content with color coding and word wrap, and you can resize the window for a better view. You can also copy XML data from the results window or Data Inspector window to edit offline in XMLSpy. The updated external file is easily replaced in the database.
XMLSpy & SQL Database Integration:
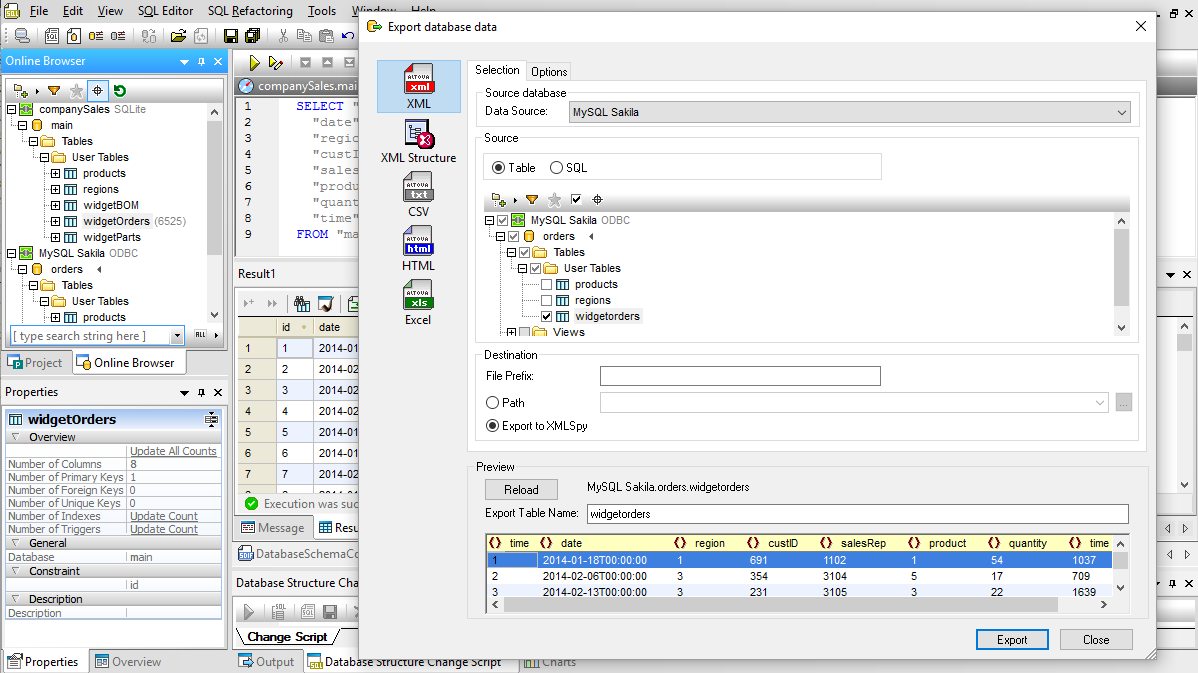
DatabaseSpy lets you select any table or view from any connected database for export. If you select multiple tables or views for export, each is written to a separate file. You can also export XML, XML Structure, CSV, or HTML directly to Altova XMLSpy. When you’re working in the SQL Editor you even have a dedicated Export button to let you instantly open an export dialog box pre-loaded with your current SQL Editor statements.
DatabaseSpy lets you import data into your databases from conventional CSV files or from files containing XML data. Using either format, you can create new tables or update existing tables in your database.
Database Import/Export Features:
If you need to convert data from a dissimilar format before importing it to your database, Altova MapForce is the visual mapping tool with the power to map any combination of XML, database, text, or EDI files. MapForce can connect to all major databases and convert source data on the fly for direct insertion.
Supported Databases:
While many SQL editors are specialized for one particular database system, Altova DatabaseSpy supports 15 of the most prevalent relational database types including SQL Server, SQLite, Oracle, MariaDB, Firebird, DB2, PostgreSQL, Informix, and several others. Customers do not need to pay separately to connect to each DB type: they are all supported by DatabaseSpy.
Users can connect to any supported database for SQL editing, database structure design, content editing, and database conversion tasks.
AI support in a SQL tool is very helpful for increasing productivity and helping with SQL script generation. One such AI-ready database tool is Altova DatabaseSpy. It integrates ChatGPT functionality for query writing, data modeling, error resolution, and more.
AI Chat Dialog in DatabaseSpy lets you enter natural language prompts to generate sample SQL statements, create sample data for a given table structure, create relations between tables that have no keys yet, and so on. The software also includes AI functionality for describing existing SQL statements and troubleshooting errors.
Of course, you can run your own queries in addition to those generated by AI.
For teams with varying skill levels, it is helpful to have a database tool that caters to both beginners and advanced users.
One such SQL tool is Altova DatabaseSpy. DatabaseSpy was designed to increase productivity for database developers, DBAs, and data analysts of all skill levels. It offers a user-friendly interface with visual tools and wizards for beginners, while also providing advanced functionality such as SQL debugging, schema comparison, and database profiling for experienced users.
DatabaseSpy also offers integrated AI functionality for generating and explaining SQL statements. This can be helpful for beginners learning SQL and advanced users looking to increase their productivity.
Determining the affordability of a full-featured SQL tool can depend on various factors such as your specific requirements, the features you need, and your budget constraints. While there are some open source database tools that are free, they may have limited feature sets and/or only connect to a small number of database servers.
One full-featured SQL tool known for its affordable price is Altova DatabaseSpy. This software starts at $169 for a perpetual license. This includes connectivity to the 15 most prevalent database types and a rich feature set including AI-integration, table browsing, data editing, SQL auto-completion, visual table design, database conversion, and more. These additional capabilities can provide greater flexibility, scalability, and efficiency, especially for complex business needs.