Chart Example: Candlestick
Candlestick charts are typically used for representing the movement of share prices on the stockmarket. There are two types of candlestick charts:
•Four-series candlestick charts, representing the opening, the highest, the lowest, and the closing prices of the day.
•Three-series candlestick charts, representing the the highest, the lowest, and the closing prices of the day.
The file Candlestick.xml, which is available in the folder C:\Documents and Settings\<username>\My Documents\Altova\XMLSpy2024\Examples\Tutorial, is an example of an XML document structure that could be used for candlestick charts. The listing below shows the essential structure of the file.
<Trades>
<Stock name="MyStock">
<Day id="20110103" year="2011" month="Jan" week="01" date="03">
<Open>90</Open>
<High>110</High>
<Low>88</Low>
<Close>105</Close>
</Day>
.....
</Stock>
</Trades>
A candlestick chart can be created for the file mentioned above as follows:
1.With the cursor inside the Day element tag, click the New Chart button of the Charts window. This pops up the Select Columns dialog (screenshot below). If the Include Indices check box is not checked, then check it and click Update Columns.
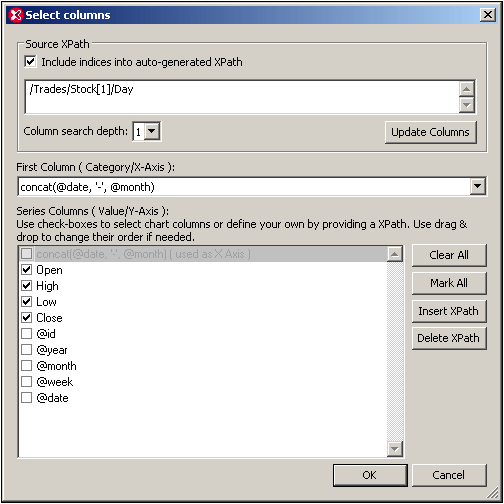
2.Click the Insert XPath button and insert the XPath expression: concat(@date, '-', @month).
3.From the dropdown list of the First Column combo box, select the XPath expression you just entered. This will create the date and month of each Day element as the labels of the X-Axis ticks.
4.For the Y-Axis series, select the Open, High, Low, and Close check boxes in the Series Columns pane.
5.Click OK.
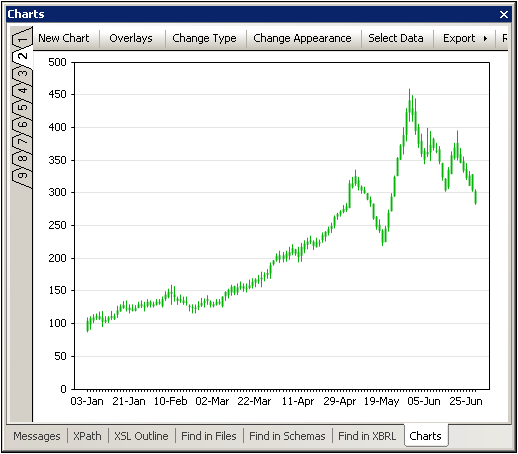
6.Click the Change Type button of the Charts window and change the chart type to Candlestick.
7.Click OK. This will create a candlestick chart like the one in the screenshot below.
Selecting a data subset
If you wish to view a subset of the chart data selected in the Select Columns dialog, for example, if you wish to view a certain range of dates within the chart data selection, click the Select Data button of the Charts window. This pops up the Select Data dialog (screenshot below).
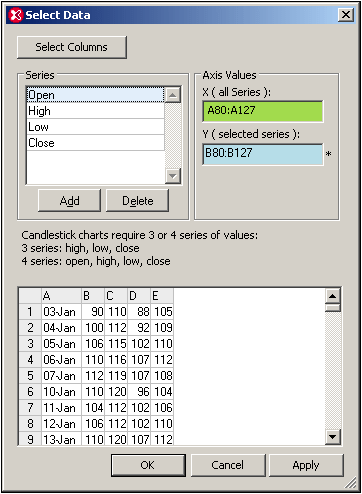
In the Axis Values pane, enter the X-Axis range, for example, the cells A80:A127, as in the screenshot above. For the various series, first click in the Y-Axis text box, then select the series in the Series pane, and then enter the range for that series. Do this for each of the four series. For example, the screenshot above shows the Y-Axis range selected for the Open series. For more information about the Select Data dialog, see the section, Chart Data.