Charts
When an XML document is open in Text View or Grid View, a chart (pie chart, bar chart, etc) representing selected data in the XML document can be generated in the Charts Window (which is one of the Output Windows). The chart can then be exported as an image file or as an XSLT or XQuery fragment to the clipboard. The Charts feature is useful for quickly representing selected numeric data in an XML document graphically.
The following chart types are available:
•Pie charts (2D, 3D)
•Bar charts, single bars (2D, 3D)
•Bar charts, grouped bars (2D, 3D)
•Stacked bar charts
•Category line graphs
•Value line graphs
•Area charts and stacked area charts
•Candlestick charts
•Gauge charts (round and bar)
•Overlay charts
Overview: from creation to export
The steps to create a chart are described broadly below. For a more detailed account, see the subsections of this section.
1.In Text View or Grid View, select the node that you wish to use as the context node for the data selection. You can also select a range of nodes. The implications of the various selection methods are explained in the section Source XPath.
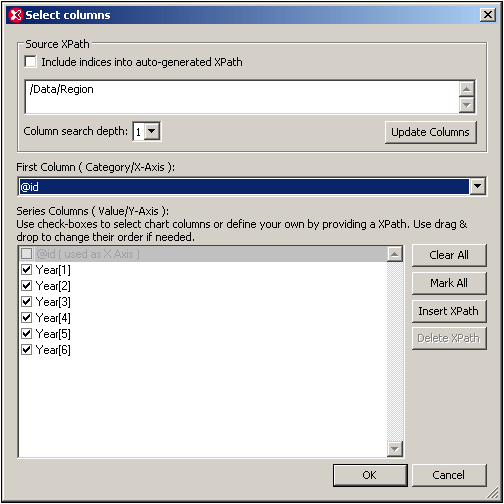
2.Right-click and, from the context menu that appears, select the command New Chart. Alternatively, in the Charts output window, click the New Chart button. This pops up the Select Columns dialog (screenshot below), in which the X-Axis and Y-Axis data will be selected and in which the Source XPath can be modified.
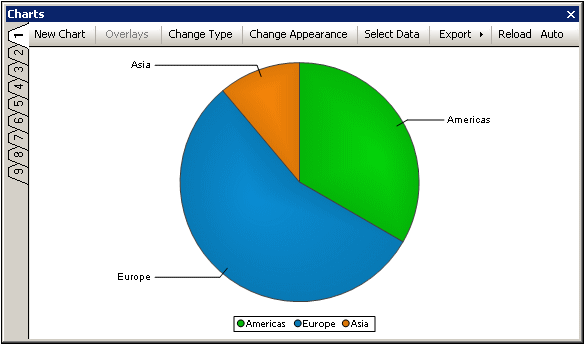
3.On clicking OK, the chart is created in the Charts Window (see screenshot below).
4.The chart's data selection and other settings can subsequently be edited. Not only can its Source XPath and column selection be edited, but also its type and appearance. The data selection for the chart's axes can be edited by clicking the Select Data button. And the chart's type and appearance can be modified by clicking the Change Type button and Change Appearance button, respectively.
5.The chart can be exported as an image file or as an XSLT or XQuery fragment to the clipboard.
Other features
The following features help to make usage easier:
•Multiple tabs: If you wish to create a new chart without deleting the current chart, then create the new chart in any one of the other tabs marked one to nine (see screenshot above). Note that, even when an XML document is closed, charts generated from that document will stay open in their respective tabs in the Charts Window.
•Auto Reloading: If the Auto button (see screenshot above) is toggled on, then the chart will be automatically reloaded every time data in the XML document is modified. Otherwise, the chart will have to be manually updated by clicking the Reload button.
Example file
In this section and subsection, explanations about how charts work reference an XML file called YearlySales.xml. This file is available in the folder C:\Documents and Settings\<username>\My Documents\Altova\XMLSpy2024\Examples\Tutorial.
<?xml version="1.0" encoding="UTF-8"?>
<Data xmlns:xsi="http://www.w3.org/2001/XMLSchema-instance"
xsi:noNamespaceSchemaLocation="YearlySales.xsd">
<Region id="Americas">
<Year id="2005">30000</Year>
<Year id="2006">90000</Year>
<Year id="2007">120000</Year>
<Year id="2008">180000</Year>
<Year id="2009">140000</Year>
<Year id="2010">100000</Year>
</Region>
<Region id="Europe">
<Year id="2005">50000</Year>
<Year id="2006">60000</Year>
<Year id="2007">80000</Year>
<Year id="2008">100000</Year>
<Year id="2009">95000</Year>
<Year id="2010">80000</Year>
</Region>
<Region id="Asia">
<Year id="2005">10000</Year>
<Year id="2006">25000</Year>
<Year id="2007">70000</Year>
<Year id="2008">110000</Year>
<Year id="2009">125000</Year>
<Year id="2010">150000</Year>
</Region>
</Data>