Table Structure
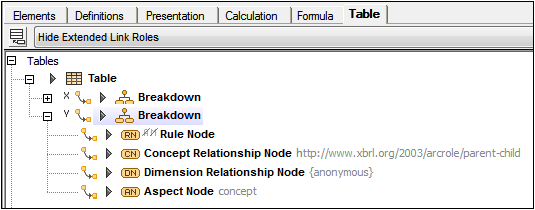
The structure of a table in the table definition is defined by the table's axes (X,Y,Z) , each of which corresponds to one or more breakdown components (see screenshot below).
•The X and Y axes correspond, respectively, to the columns and rows of the generated table. They are described in the section, X and Y Axes.
•If a Z axis is defined, it is presented as a separate table. See the section, Z Axis.
•Each breakdown component can contain multiple table definition nodes (see screenshot below). There are different types of definition nodes:
— rule nodes (RN icon in the screenshot below)
— concept relationship nodes (CN)
— dimension relationship nodes (DN), and
— aspect nodes (AN).
See the section Definition Nodes for a description of the structural properties of these definition nodes.

Projections for multiple breakdowns
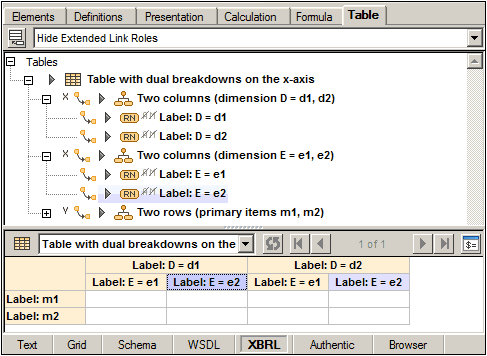
Multiple independent breakdowns may be associated with a single table axis. The mechanism for resolving how multiple breakdowns combine into a single “effective” breakdown is called projection. The relative priority of multiple breakdowns for a single axis is determined by the @order attribute of each breakdown. The breakdowns are visualized as trees. For each leaf of the first breakdown, the entire second breakdown is attached, and so on, recursively.
In the screenshot below, for example, there are two breakdowns for the X axis: dimension D is ordered at a higher priority than dimension E. So, for each leaf of dimension D (d1 and d2) the entire tree of dimension E is attached. Since the X axis generates columns, these breakdowns create a projection for the column structure of the table. See the table layout preview in the screenshot below.
