Web Service Data Integration
In a previous post we wrote that every data integration and reporting task needs to start with a clear understanding of the source data. Using grid view in XMLSpy, the industry-leading XML and JSON editor, we analyzed JSON data for 5-day weather forecasts retrieved from a Web service.
Continuing with our earlier scenario, we’ll use MapForce, the award-winning, graphical data mapping tool for any-to-any conversion and integration, to map the forecasts for a series of major cargo shipping ports into nicely formatted Excel documents. We’ll want to highlight any predicted high winds or heavy rainfall that could cause delays by interfering with cranes loading and unloading containers, or slowing ships entering and exiting the harbors.

The REST request for weather forecasts accepts latitude and longitude coordinates to return a 5-day forecast for any location in the world. A single MapForce mapping can map multiple inputs and outputs, so we’ll start the Web service data integration project by building a list of cargo ports and their coordinates.
It’s quick work to create the list as a new JSON document in Grid View in XMLSpy by typing in the data without worrying about the JSON syntax characters. In the image below we clicked the icon at the top left to display the list in a tabular format:
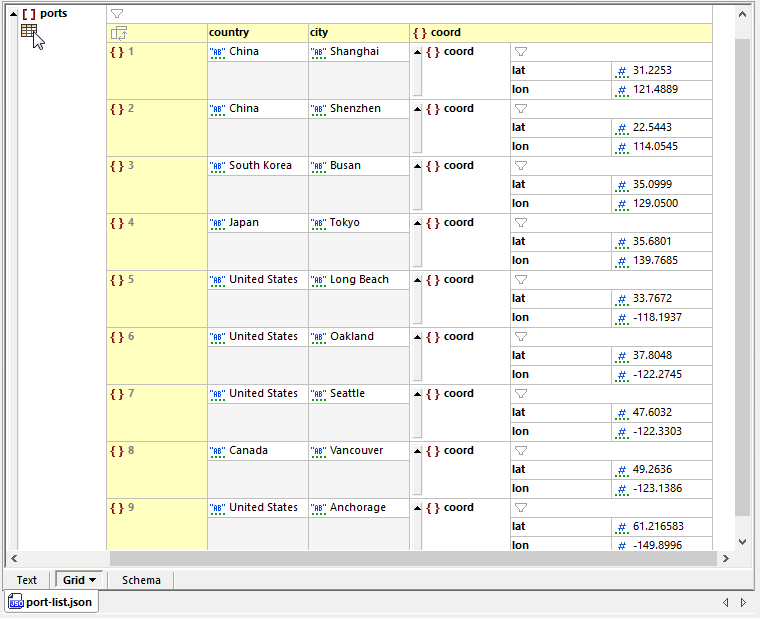
Grid View makes it much easier to examine and review the file contents, as opposed to Text View, which displays all the syntax characters necessary in a valid JSON file.

Data Mapping Overview
The MapForce Web service data integration project will take the list of ports as the input file, issue a REST request for each set of coordinates, and map the resulting JSON data for each port into an Excel worksheet.
MapForce uses JSON schema files, following json-schema.org specifications, to model JSON data structures for mapping. MapForce can automatically generate a JSON schema from a JSON instance. That will work fine for the single port-list.json document.
We also need a JSON schema to map the data returned by the Web service, which is a little more complicated. We don’t have a single .json forecast file that includes all possible variations of required and optional data in the response.
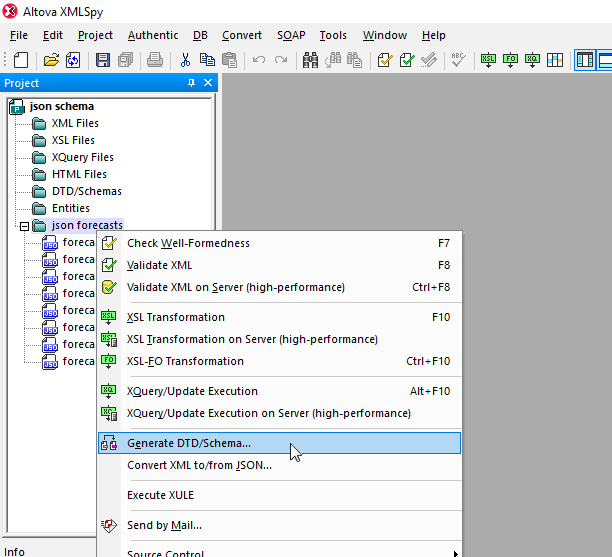
Fortunately, XMLSpy can generate a JSON schema based on multiple instance documents collected in an XMLSpy Project folder.
Opening the resulting schema in JSON Schema view, we see the rain object is optional. That’s because at least one of the forecast instance files had no rain predicted over the entire 5 days, therefore no rain objects were included in the response.
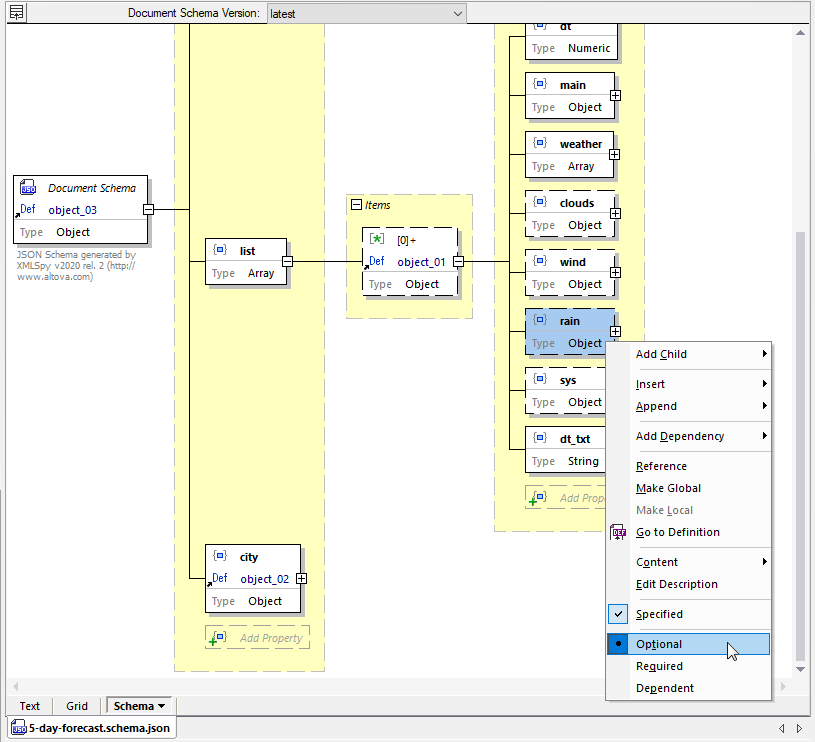
We can use this schema to describe the REST response data in the mapping.
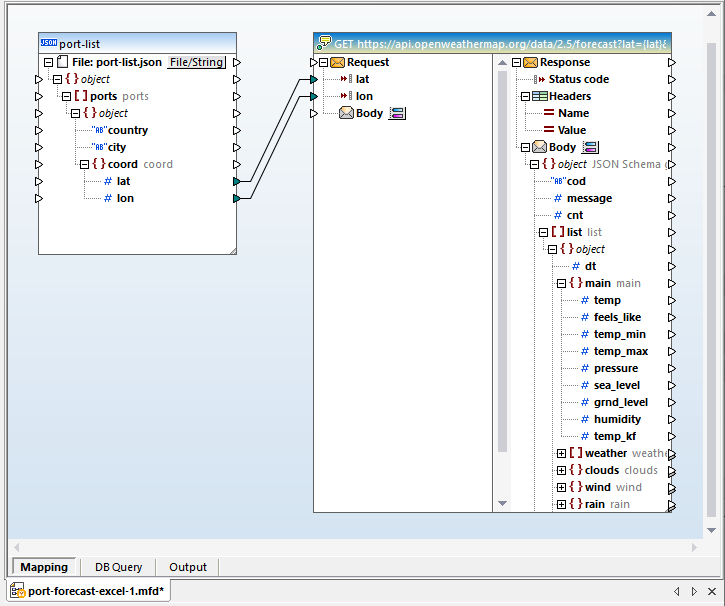
In the image below, we have begun building the data mapping by dropping in the post-list.json file and a new Web service. We added the REST URL and mapped the latitude and longitude coordinates as input parameters to build the request. So far, the body of the response has no structure.
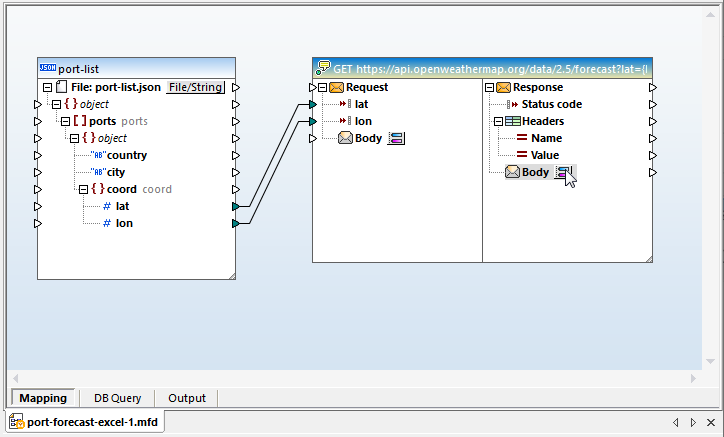
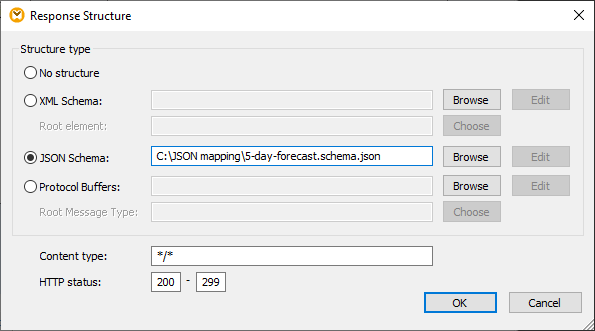
We can click the body to open the Response Structure dialog and assign the schema we generated in XMLSpy:
Once the schema is assigned, all the items in the body are available for mapping:
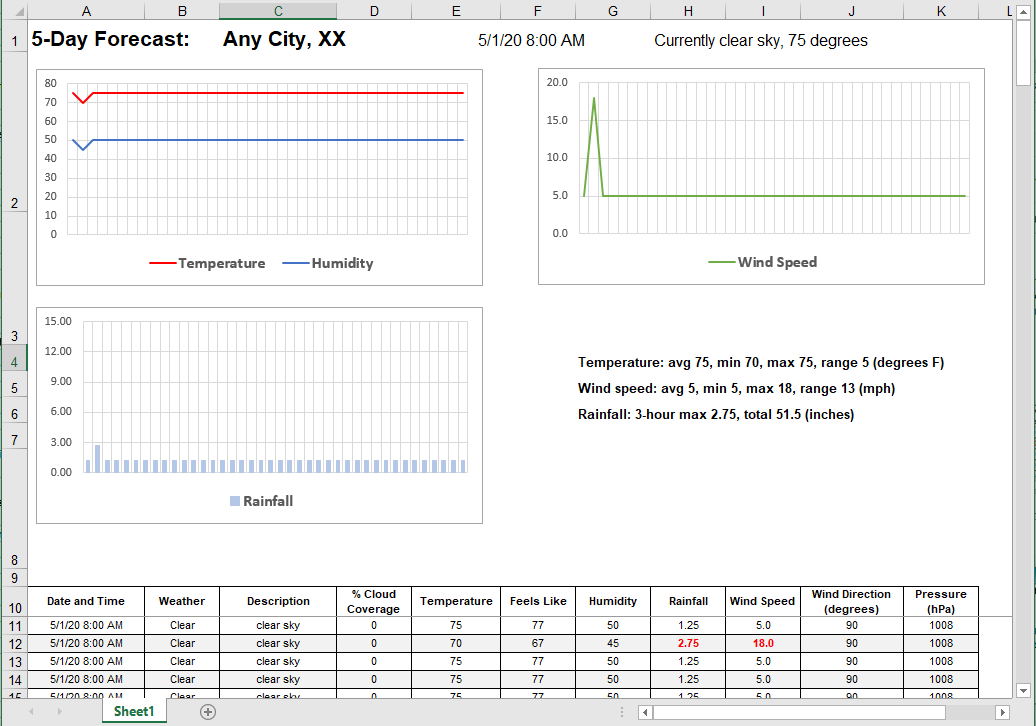
Now we can add the target Excel file. We’ve been given an example spreadsheet to use as a model, with some cell styles and graphs, and dummy data:
We can add this spreadsheet to the Web service data integration mapping as the target, but we still need to identify the cells to receive data:
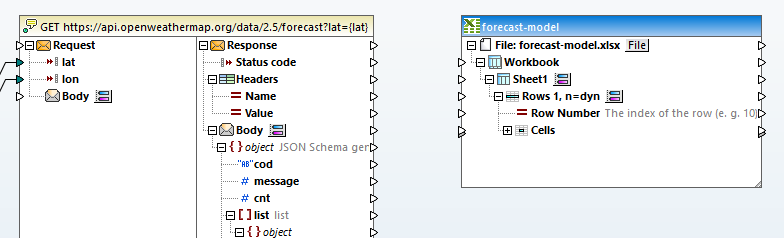
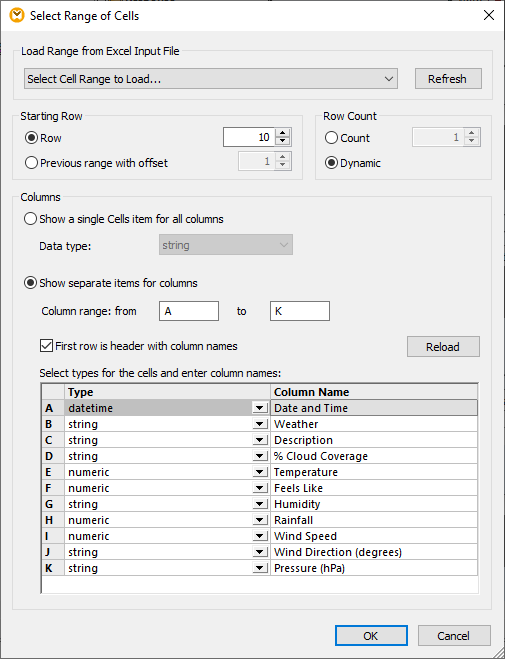
Clicking the button to the right of the Rows 1, n=dyn entry opens the Select Range dialog. Row 10 contains column headers for the data, so we want to map the main table starting at row 11 into columns A through K. The columns have different data types, which mostly correspond to text or numeric types in the JSON source and format types in Excel. The Select Range dialog lets us define the exact targets and data types:
Identifying the column names in the Select Range dialog adds them as labels in the output mapping. Next, we can build the logic to map each forecast to a separate Excel file, as seen below:
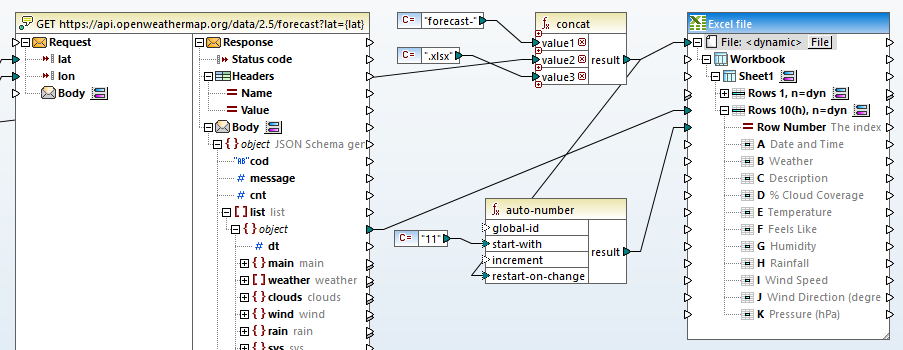
The file name at the very top of the Excel target is set to <dynamic>, which specifies that the mapping will generate file names. Each actual filename is built by a concat function that embeds the city name from the source list, creating names like forecast-Seattle.xlsx, etc.
We also need to make sure the main data table in each file restarts at row 11. To do that, we linked the top-level object of the list array to the target at Rows 10, n=dyn and used an auto-number function to reset the starting row each time the file name changes.
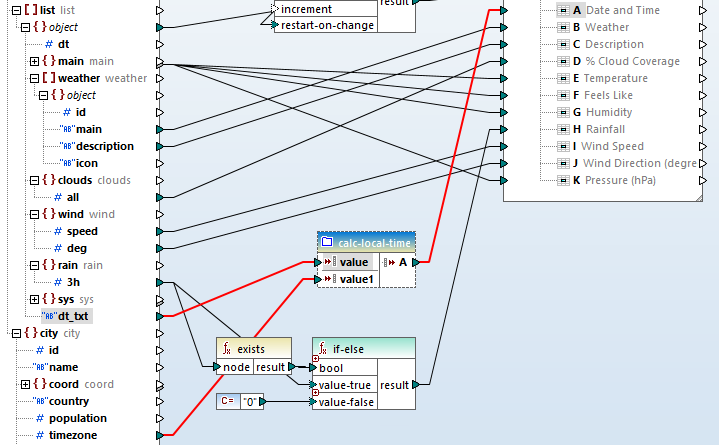
Each list object in the response will be mapped to a new row in the Excel spreadsheet. Now we can link individual items in the response to columns in the row. In the image below we have connected all the items that need no further transformation.
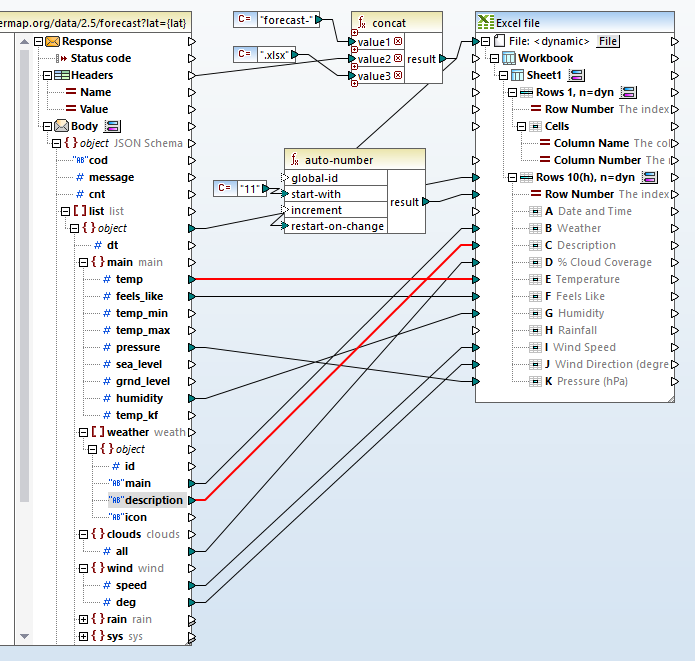
For the directly linked items, the data types in the JSON response correspond directly to the types we specified for columns in the spreadsheet. Temp in the source JSON data is numeric and column E in the target is numeric. The data type for description in the source is string and column B in the target is string, and so on.
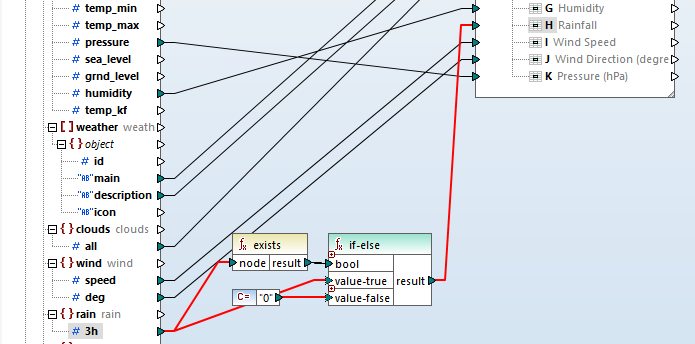
In the JSON schema for the response, we saw the rain object was optional. If it doesn’t exist, we want to substitute zero. That’s easily done by building an expression that combines exists and if-else:
One limitation of the JSON data format is it only includes two data types: string and numeric. Data types like integer and datetime, or special Excel formats like percentage, and accounting are not defined in JSON. MapForce conveniently includes built-in functions to transform source data into the desired target data types in the mapping. That’s how we can create the datetime format we want in column A of the Excel table.
The item main.dt_text in the JSON data is the date and time represented as a string, such as: 2020-05-09 06:00:00. MapForce has a parse-dateTime function that takes the string and a format model as input and provides a datetime result. But one more complication: the dt-txt string is in the GMT time zone, not local time for the forecast city. The local offset is provided in the city.timezone item as positive or negative seconds.
To keep the main mapping view simple, we built a user function called calc-local-time. This function takes the string and the offset and calculates the local time. The user function is mapped just like a built-in function :
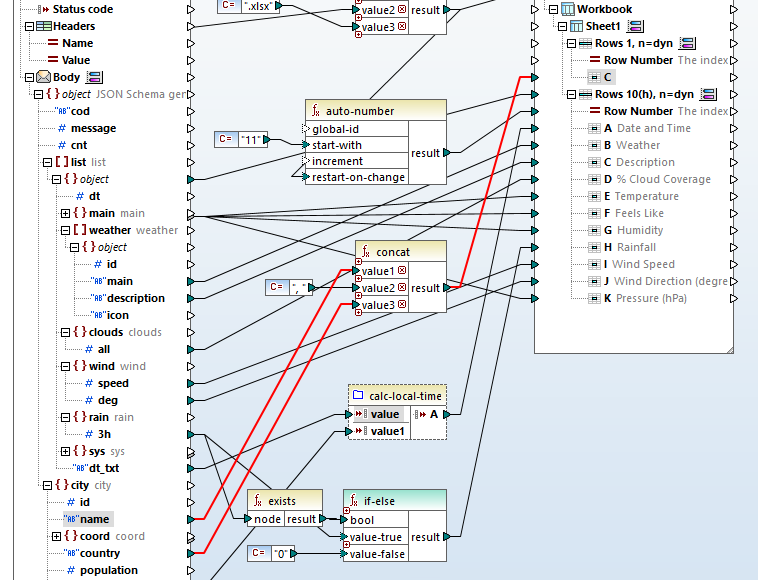
The last thing we need to do to complete the Web service data integration mapping is combine the city and country names and add them to row 1, column C:
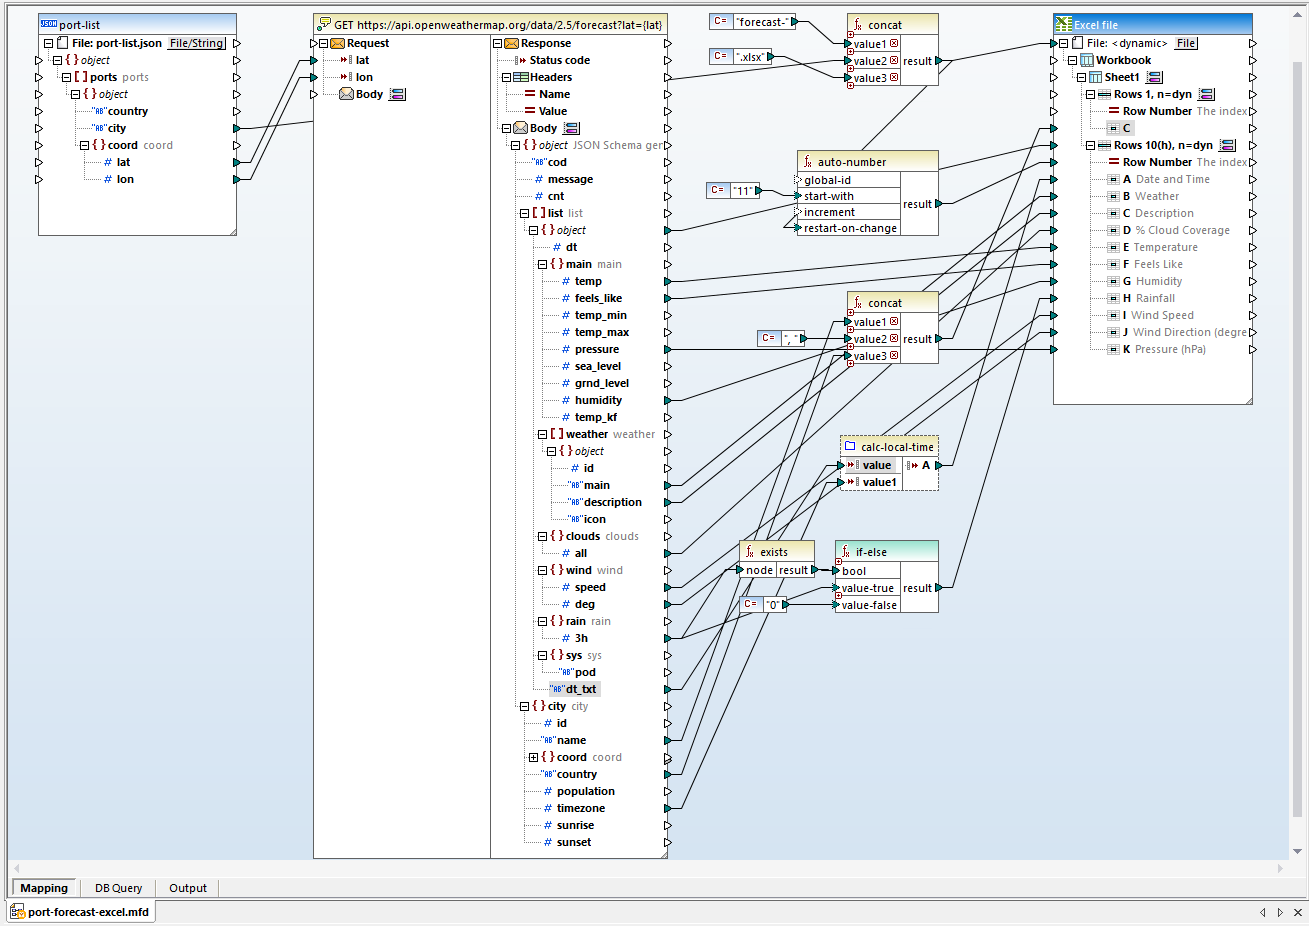
Here’s a complete view of the final mapping:
To get the properly formatted Excel documents for each city, we need an existing formatted Excel file matching each target file name. A batch file is a quick way to make the originals by repeatedly copying the original Excel sample with its styles and formulas.
Web Service Data Integration Results
Clicking the Output button at the bottom left of the mapping window executes the mapping and generates the output files. If Excel is installed on the workstation the actual Excel output is previewed in the Output window:
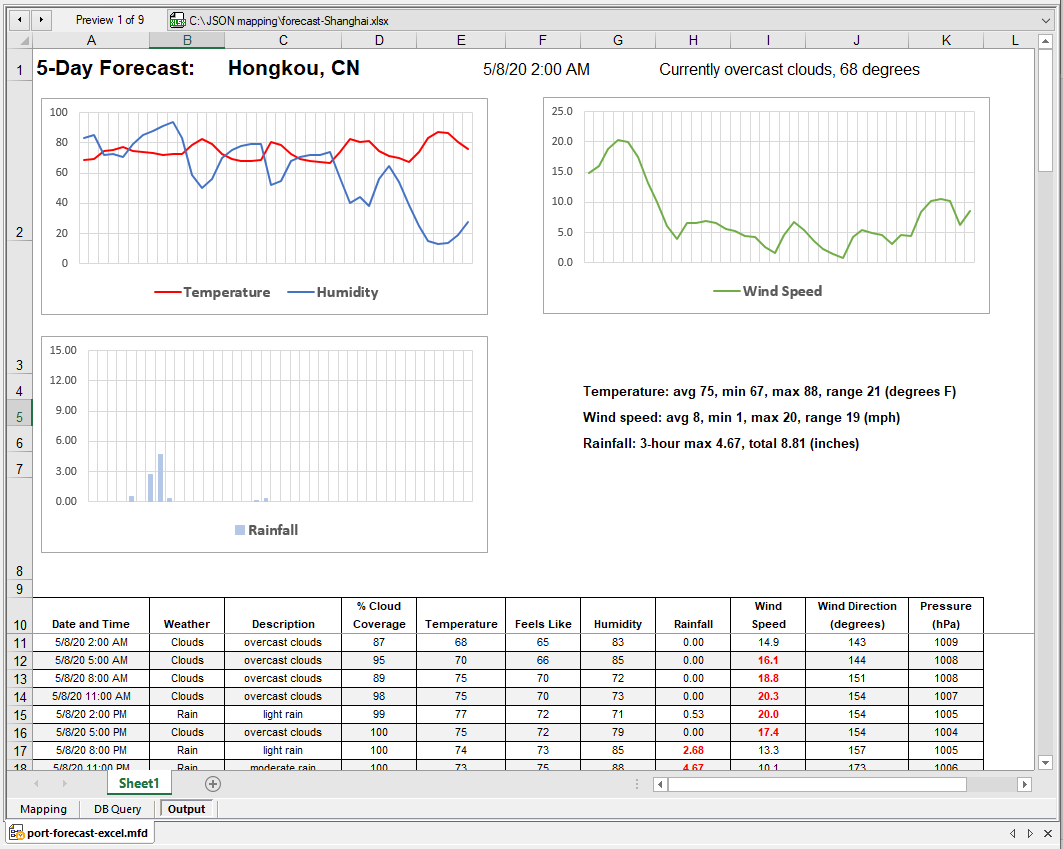
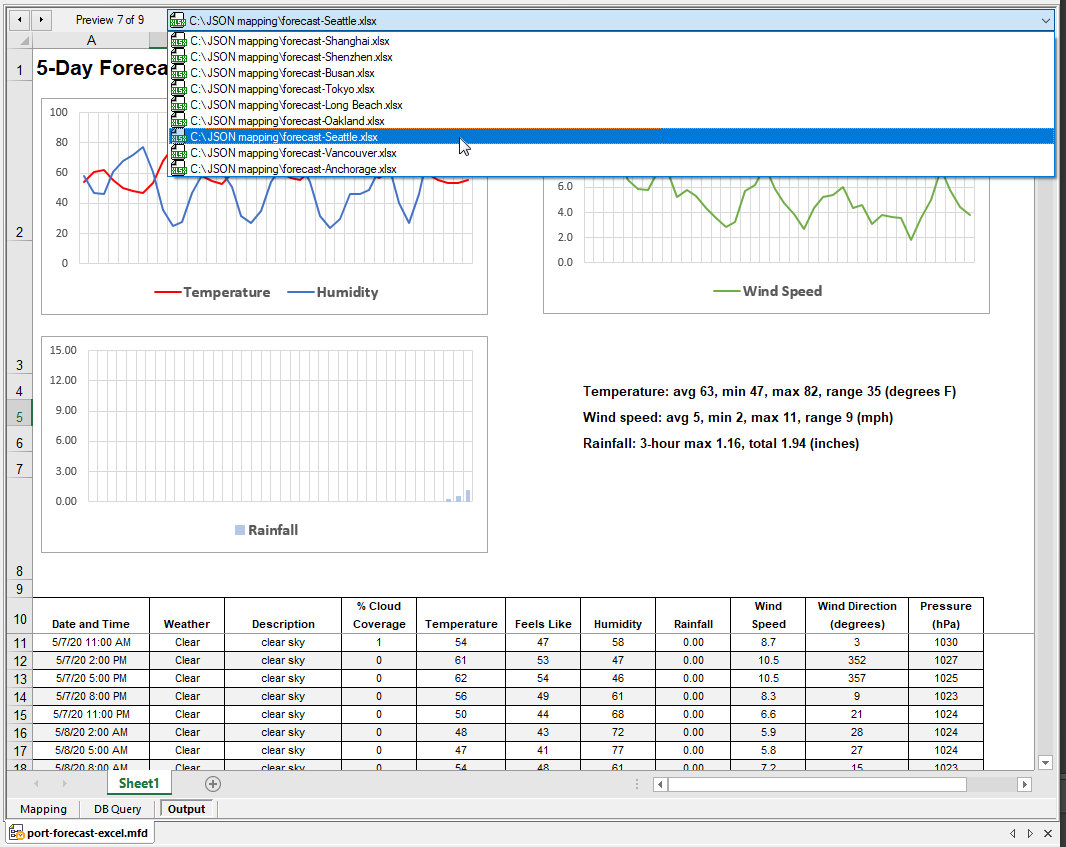
The date and time and current weather at the top, and text summaries next to the Rainfall chart are created by formulas in the Excel spreadsheet. All nine output files have been generated and we can select and preview any individual file. Shown below is the drop-down file selection list and seventh file with the forecast for Seattle:
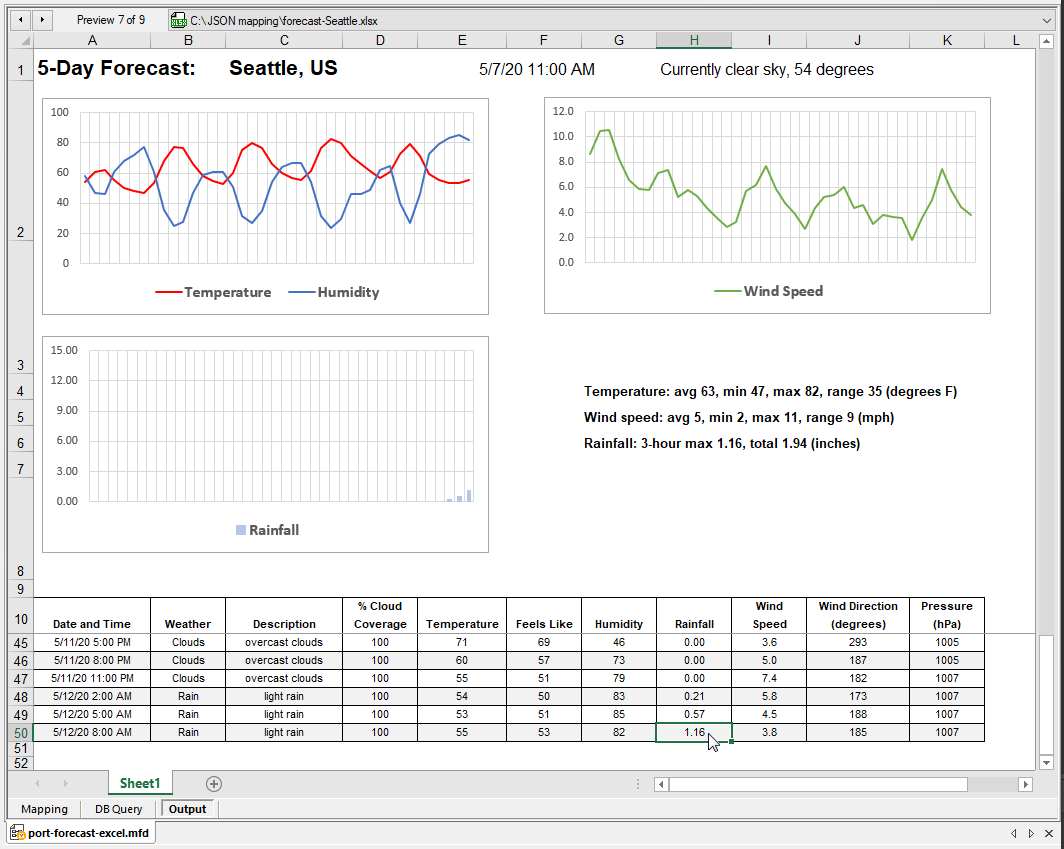
Excel functionality is available in the Preview window. For instance, this spreadsheet uses split-screen scrolling, with a locked view of the top section. We can scroll to the bottom of the main data table to see exactly how much rainfall is predicted in the last forecast. Note the row numbers on the left side:
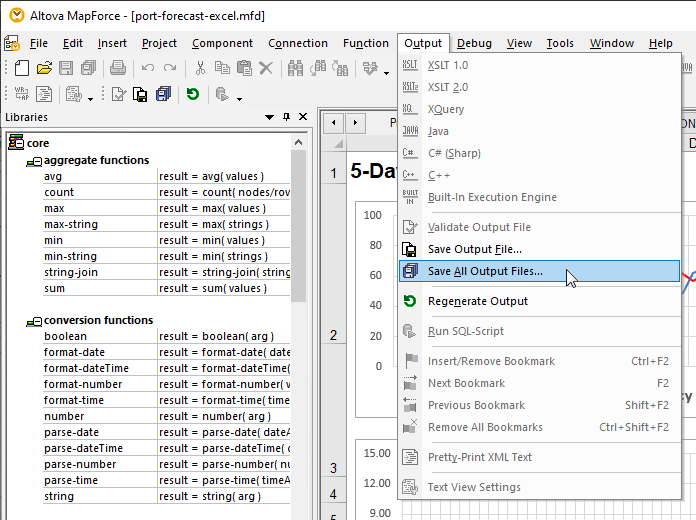
If the output is satisfactory, we can save one or all of the generated files:
Intermediate Data
MapForce is designed for data conversion efficiency. We never had to save, manage, or explicitly manipulate the intermediate JSON data from the REST response. Execution of this Web Service data integration mapping does not save the intermediate data.
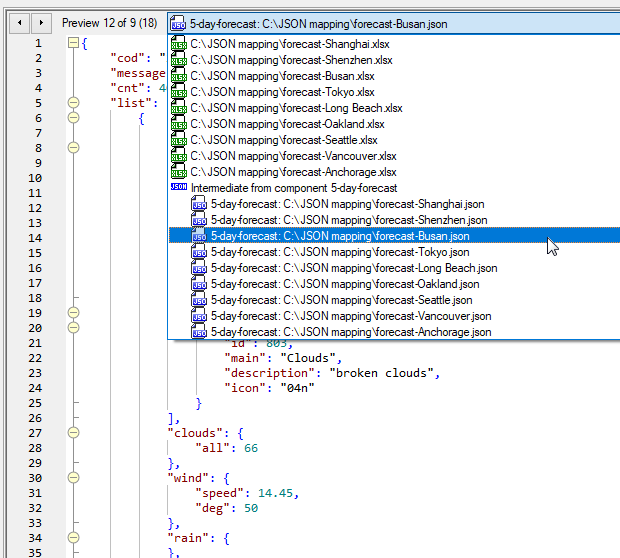
If we do want or need to save the JSON response data along with the final Excel spreadsheets, MapForce offers several options. One choice is to create a chained mapping that save the response data as an intermediate JSON file, based on the same schema as the response. Then we could map the JSON file to create the Excel output. A chained mapping lets you preview and save intermediate files as well as the final result. Shown here is the Output file list generated by a chained mapping, with one of the JSON files in Text view in the background:
Automated Web Service Data Integration
Our workflow scenario would require updating the forecasts every day. We can save the mapping as a MapForce Server execution file for automated processing by MapForce Server, or deploy it directly to FlowForce Server to generate new forecasts on an automated schedule. A FlowForce Server job can combine data integration tasks with multiple actions, including system actions like moving files or sending emails, or a FlowForce Server job can execute complex workflows that can pass results and parameters to trigger other jobs.
Watch a quick video demo of MapForce, or download a free trial including Tutorials, Help, and many more examples to get started with your own project for JSON and Web service data integration, or other data mapping, conversion, and transformation needs!