Excel Data Mapping to Update Existing Documents
Excel began life as a simple spreadsheet tool. Over time, support for rich text styling options, built-in charts, and copy and paste formatting features has led many enterprises to create reports in Excel documents. This can cause difficulty when data changes and existing documents need to be manually updated for distribution to a wide audience in the familiar report style.
Altova MapForce, the award-winning, graphical data mapping tool for any-to-any conversion and integration, supports Excel data mapping to convert data to existing Excel documents while preserving styles and formulas in the original.
This feature lets you write directly to nicely formatted Excel files to update data at runtime: any designated worksheets, rows, and cells from the specified file will be replaced with data from the mapping and all formatting in the existing file will be preserved as-is. To protect functionality in the existing spreadsheet, cells with formulas are not overwritten.
Let’s look at an example of how to map Excel data.

Of course, MapForce lets you use Excel files as the data source or target for data mapping with XML, JSON, databases, text files, EDI, XBRL and more. In this post we’ll look at mapping to an Excel target while preserving existing formatting in the spreadsheet.
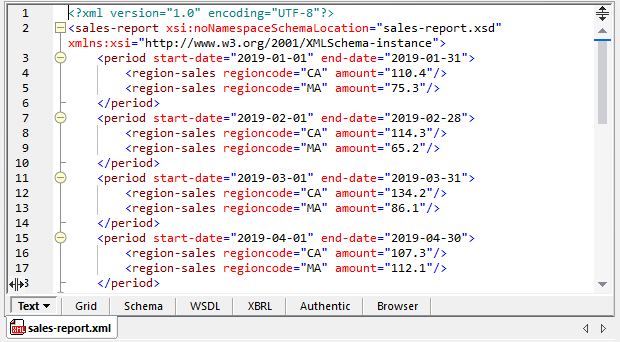
Among the samples included with MapForce is a data mapping example called Sales_to_Excel.mfd with all supporting files to map data from an XML document containing monthly sales volume into an existing Excel spreadsheet that includes rich formatting and several formulas.
The image below shows the XML source:
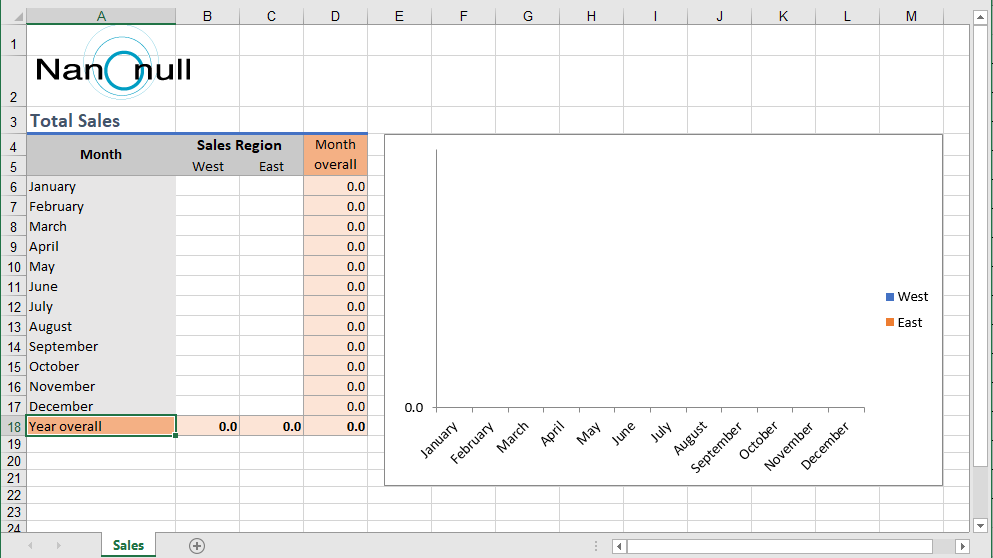
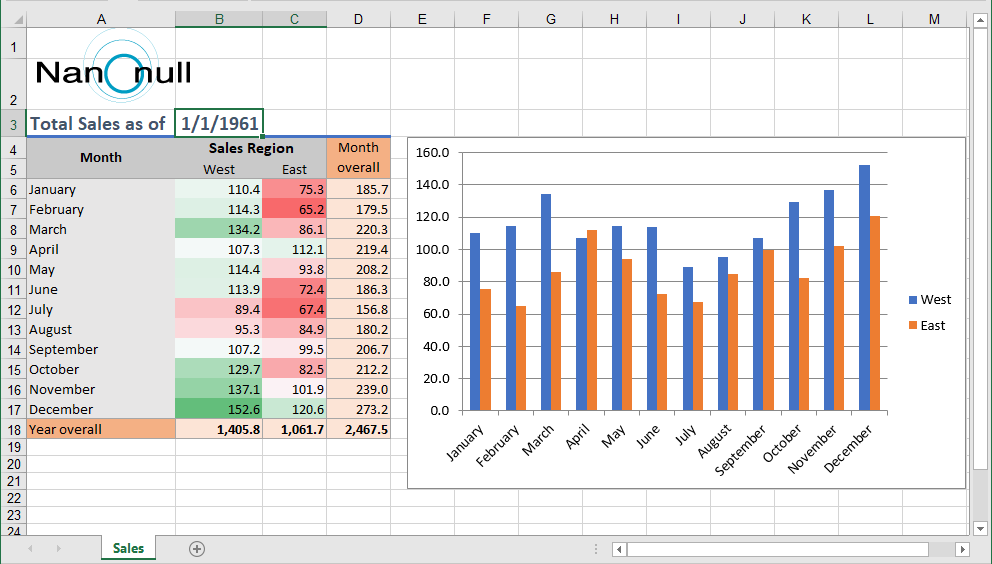
And here is the existing output target spreadsheet:
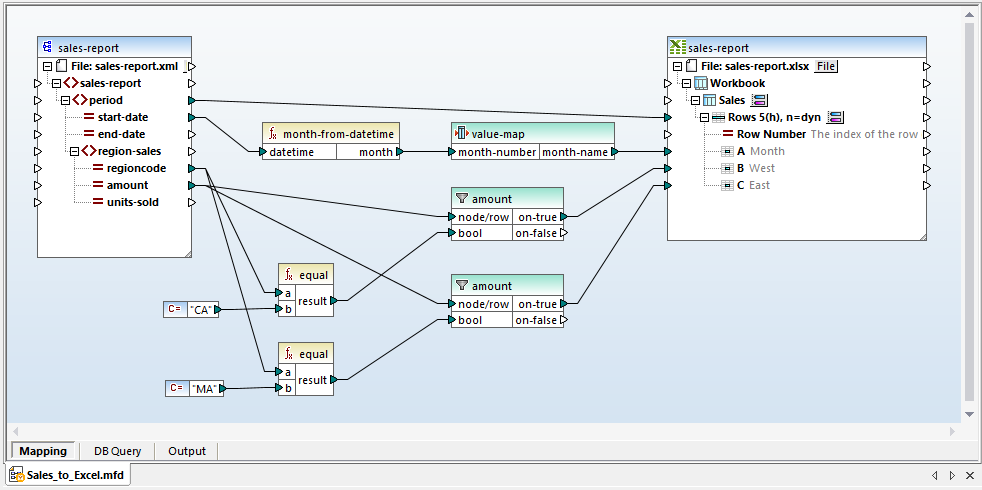
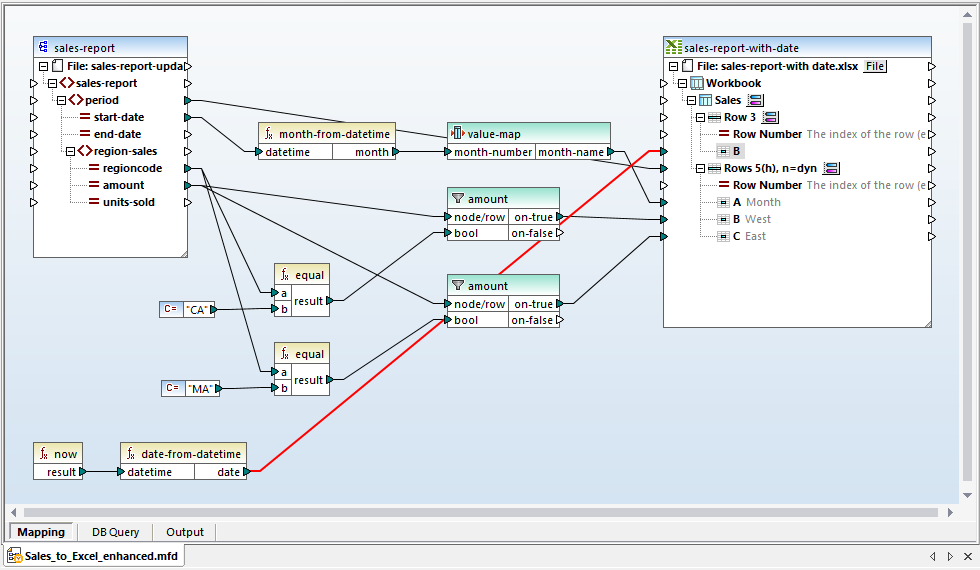
The example Excel data mapping applies functions from the MapForce function library, a value map to generate month names from numbers, and filters separate sales totals by region:
Clicking the Output button at the bottom of the mapping window executes the data mapping and the result is displayed in the MapForce output preview window:
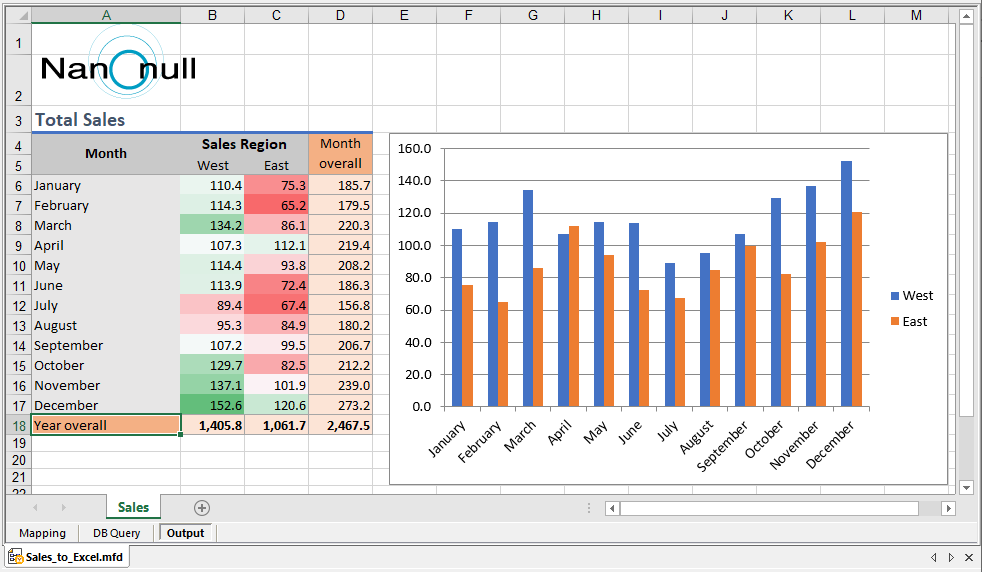
We can see in the Output preview above that only the data cells were overwritten by the mapping execution. The Year overall sums at the bottom row of the table, cell colors, and the graph were all generated based on formulas and formatting already defined in the spreadsheet.
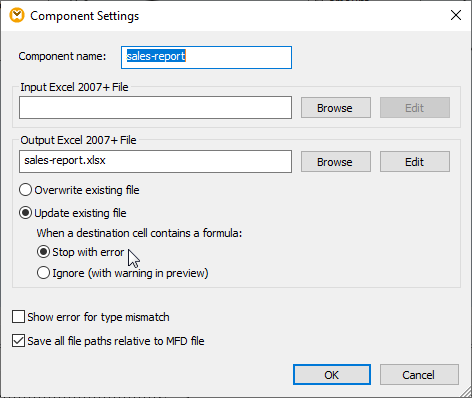
This mapping instructed MapForce to only overwrite cells containing data. You can refine mapping behavior and error handling in the Component Settings dialog:
In a real-world application, sales management and company executives might want to receive a report like this on a regular schedule, maybe even every day. We can edit the source data and re-execute the mapping to simulate an updated version of the report.
First, let’s add a date cell to the spreadsheet and generate the date in the Excel data mapping to identify the report version:
We can use the built-in MapForce now function to capture the execution date and time, and map the date into cell B3:
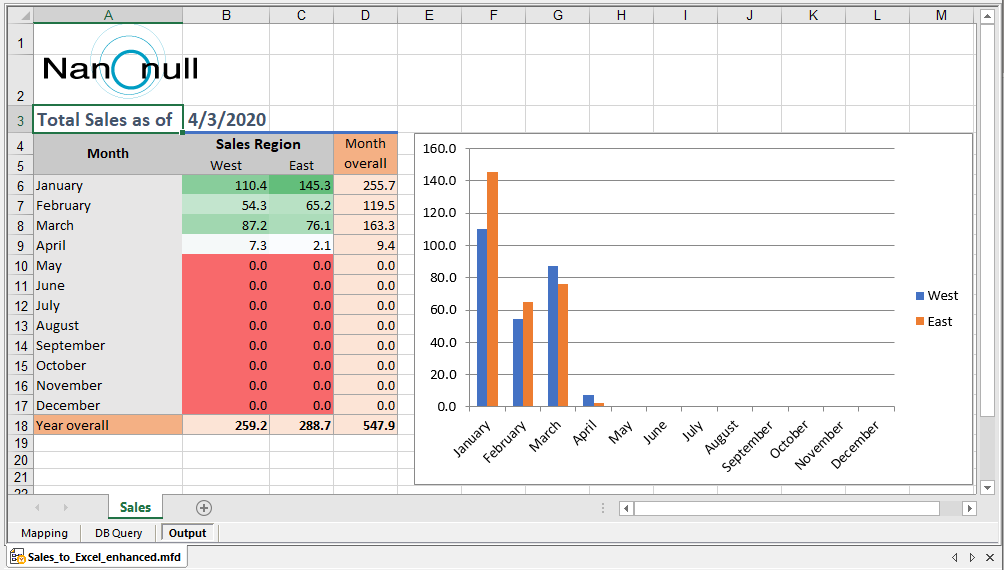
After editing the source data to simulate sales during a year-to-date period, we can re-execute the mapping to see the updated report:
We can save the mapping as a MapForce Server execution file for automated processing by MapForce Server or deploy it directly to FlowForce Server to generate a new sales report every day.
Download a free trial including Tutorials, Help, and many more examples to get started with your own project for Excel data mapping or other data mapping, conversion, and transformation needs!