API Data Mapping
Web service data integration with MapForce is a popular and proven strategy to capture timely information for analysis or generation of user-friendly reports. In an earlier post we demonstrated API data mapping in 5-day weather forecasts for busy cargo shipping ports by reading Web service data in JSON format and mapping to richly formatted Excel spreadsheets. The weather API we used is hosted by OpenWeather, a provider of historical, current, and weather forecast data.
But integrating data from any API is not a set-it-and-forget-it task. When you build a solution based on external data, you have to react quickly when the data structure changes. Since our original integration project OpenWeather revised the data delivered by their API. The API now includes wind gust predictions in a JSON property separate from wind speed. Since wind gusts are suspected as a cause of the recent Suez Canal blockage the new data is very relevant to our application! Fortunately, both the MapForce data mapping and the Excel spreadsheet are easily revised to add new data.

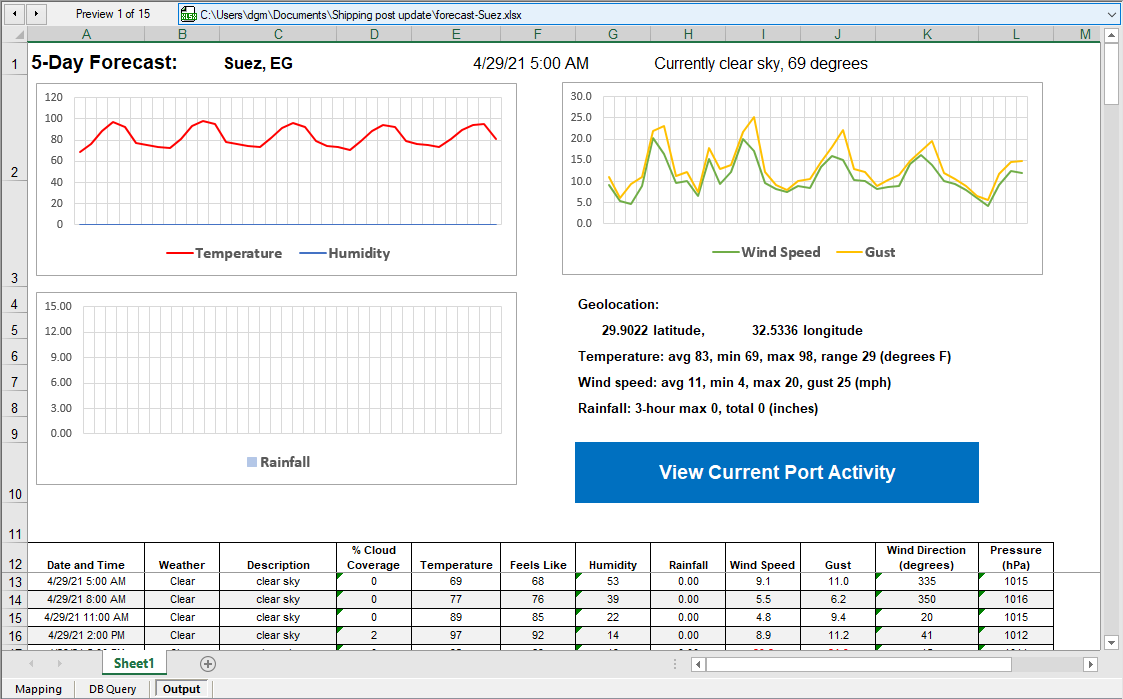
We need to understand the changes in the new target Excel output before we can modify the API data mapping. The new main table section of the 5-day forecast is seen here:
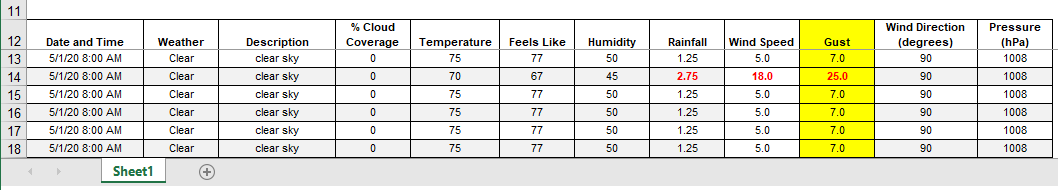
The spreadsheet creator added a new column between Wind Speed and Wind Direction to show predicted wind gusts for each forecast.
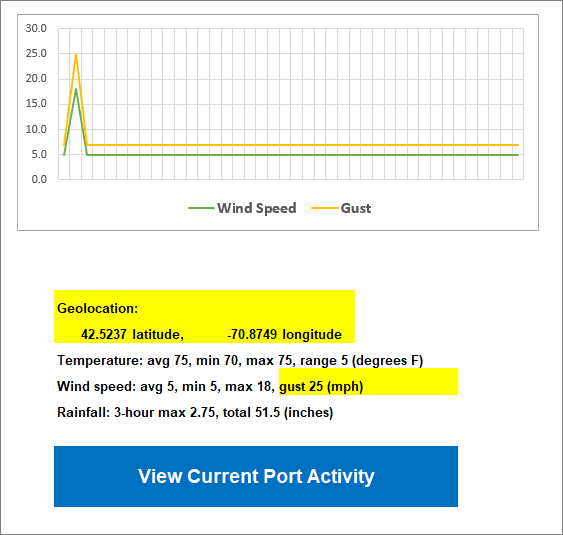
Several changes also appear in the header section of the spreadsheet. A line indicating gust speed is added to the wind chart, the geolocation coordinates of the port are added, and the maximum wind gust speed over the 5-day forecast is reported.
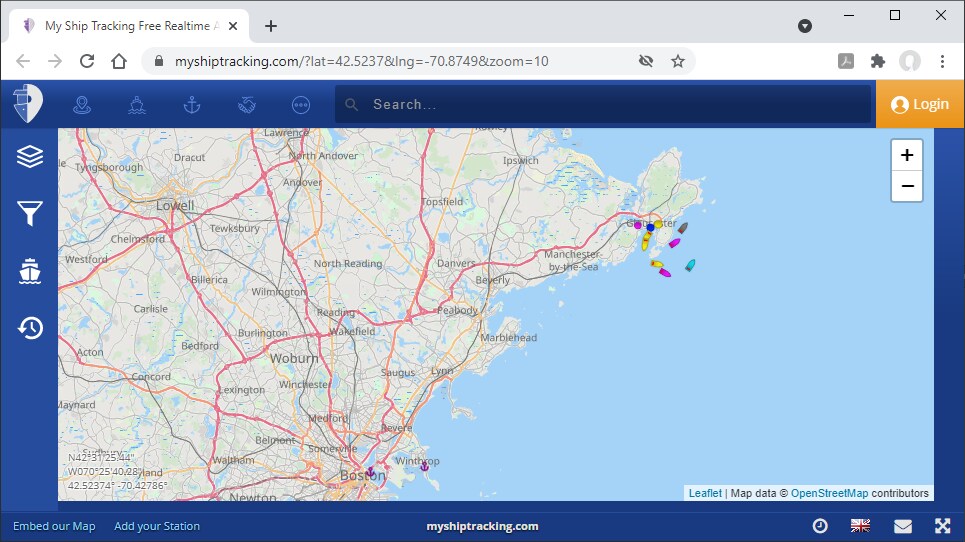
A new clickable button in the worksheet labeled View Current Port Activity opens a Web page. Commercial ships all carry transponders for the automatic identification system (AIS) that continuously broadcast the ship’s position for collision avoidance and chart plotting. MyShipTracking.com is one of many Web sites and other enterprises that use AIS technology to report real time AIS data and provide a better understanding of how vessels move around the world.
Clicking the button in the spreadsheet opens a page at myshiptracking.com showing activity near the geolocation:
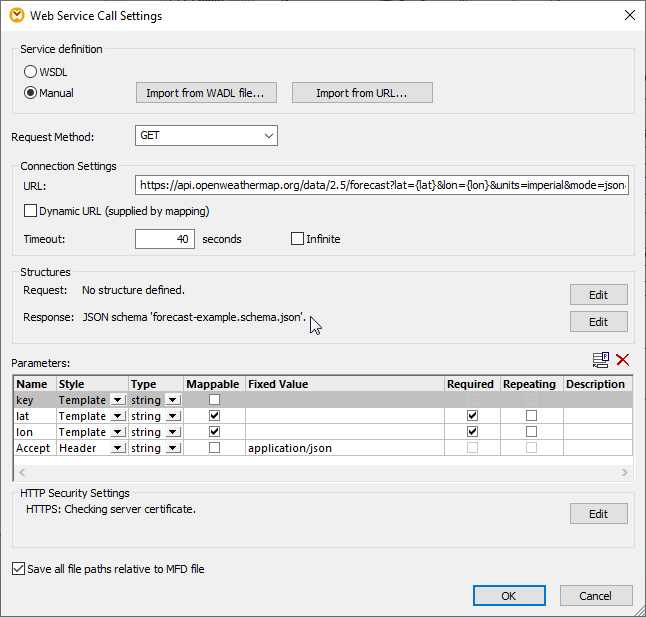
We need only a few revisions in the data mapping to support these enhancements to the target output: we need to insert the gust data at the right location in the table and we need to map the geolocation coordinates.
First, we manually executed the weather API in a browser window to get a new response example including wind gust data and we generate a new JSON Schema in XMLSpy for the API result. Saving the new JSON schema with the original file name automatically adds Gust to the Response in the API data mapping.
Labels attached to the original mapped data coordinates make it easy to find the right place to insert the new Gust column in the Excel spreadsheet:
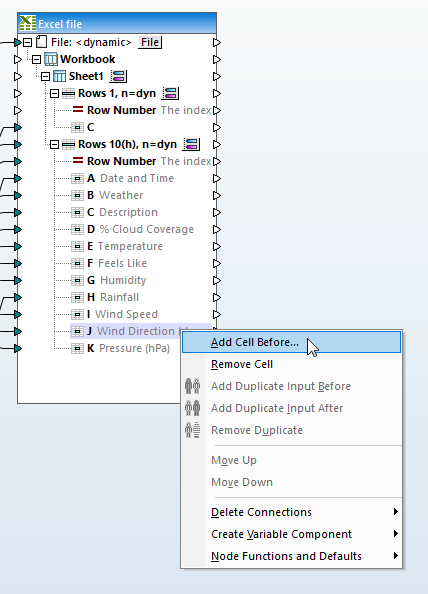
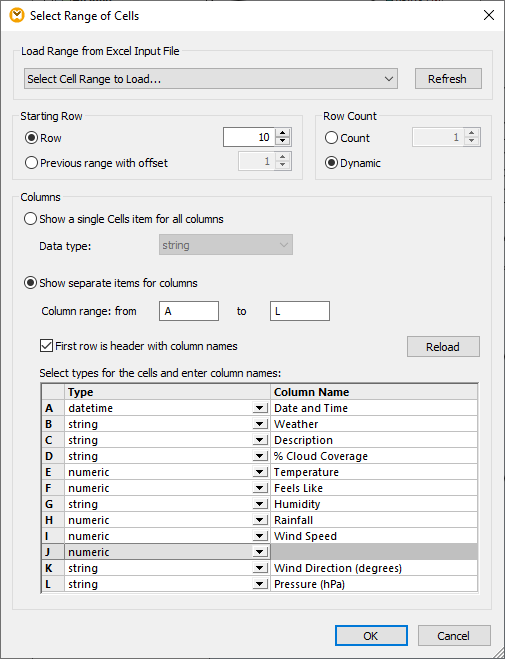
Selecting Add Cell Before from the context menu opens a dialog to add the details:
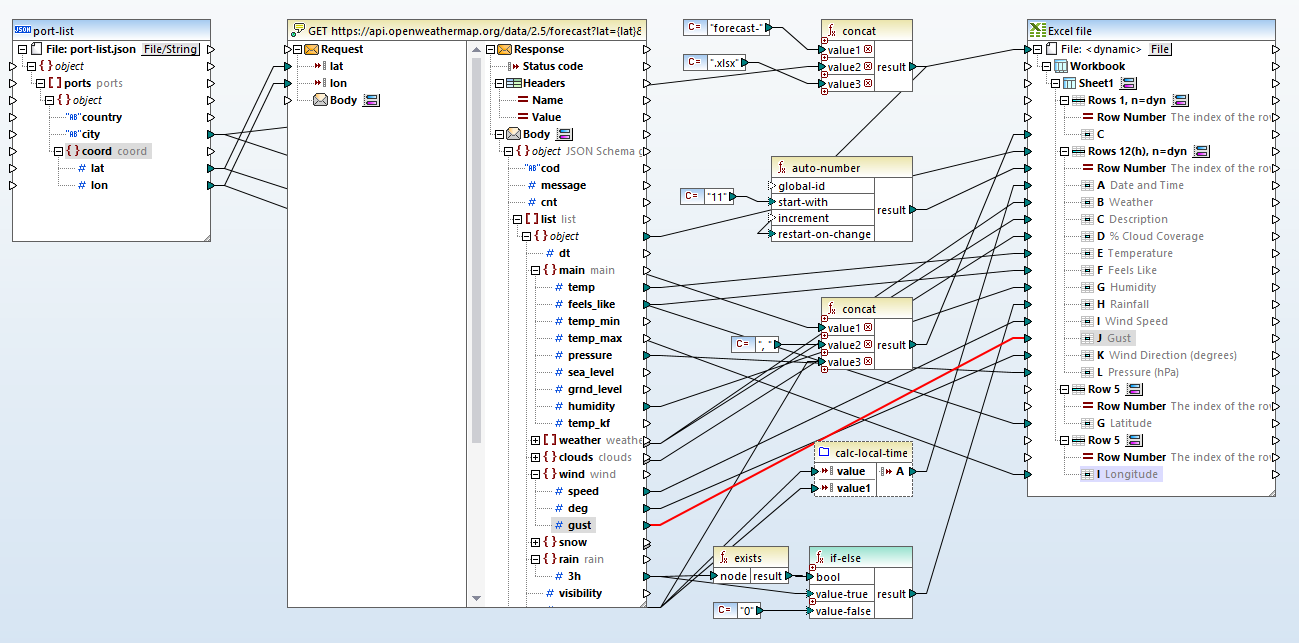
MapForce conveniently maintains the mapping connections for columns K and L so we only have to connect column J.
The new geocoordinates in the spreadsheet for latitude and longitude are at cells G5 and I5. The coordinates for each port are already in the source list of ports, since we use them to request weather forecast data from the API. We added those cell addresses at the bottom of the target list.
Here is a view of the revised mapping in the MapForce mapping pane with the new connection for wind gust predictions highlighted:
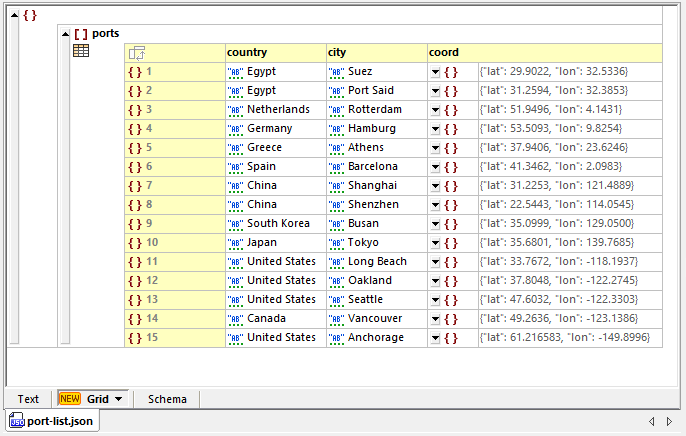
For one last enhancement we added more ports to the request list to include the Suez Canal and several large seaports in Europe. We added the new ports by editing the original JSON file with the request list in XMLSpy. Here is the new JSON file with the port requests for input to the API data mapping viewed in XMLSpy grid view:
Clicking the Output button at the bottom of the mapping pane executes the mapping and opens the Output view showing the first output file. If Excel 2007 or later is installed on the system, MapForce automatically opens Excel to present the result:
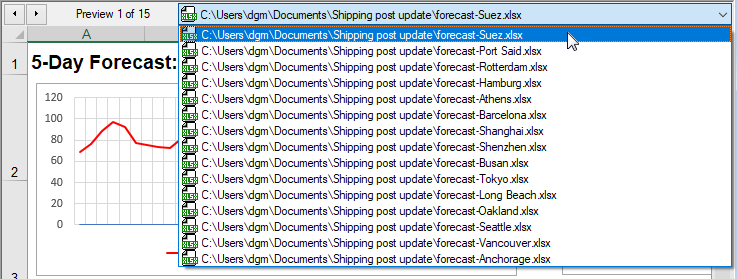
Results have been generated for each port in the source list. We can select any Excel file for preview:
Clicking the View Current Port Activity button in the Preview window works exactly as when the file is opened directly in Excel:
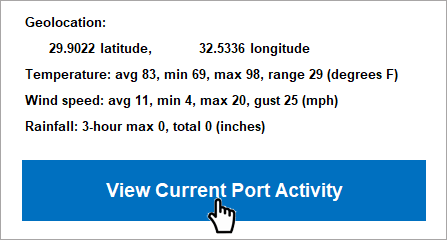
The result is based on the port latitude and longitude:
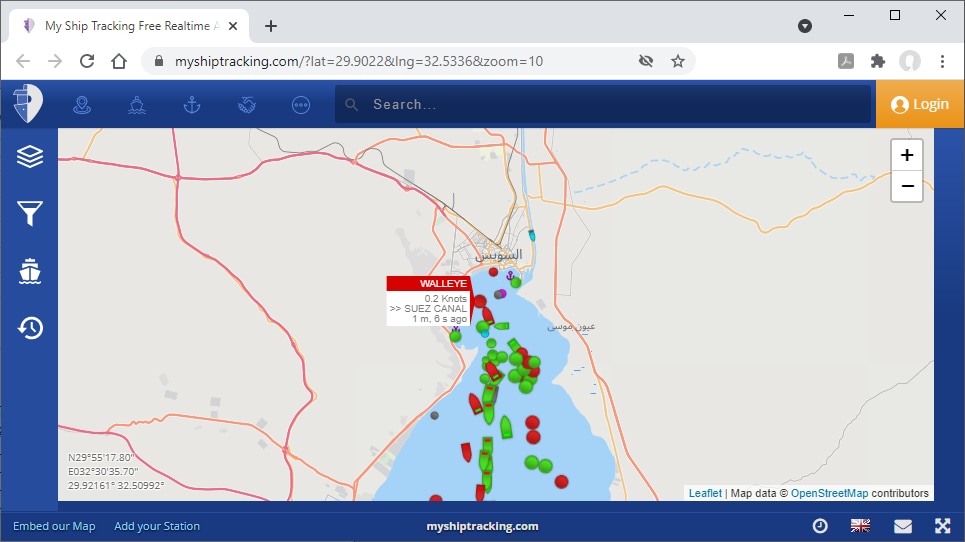
Each dot on the map represents a vessel with an AIS transponder reporting in real time. To further validate our results we can preview any other output file and check the link for another port. Here is the map for Hamburg, Germany:
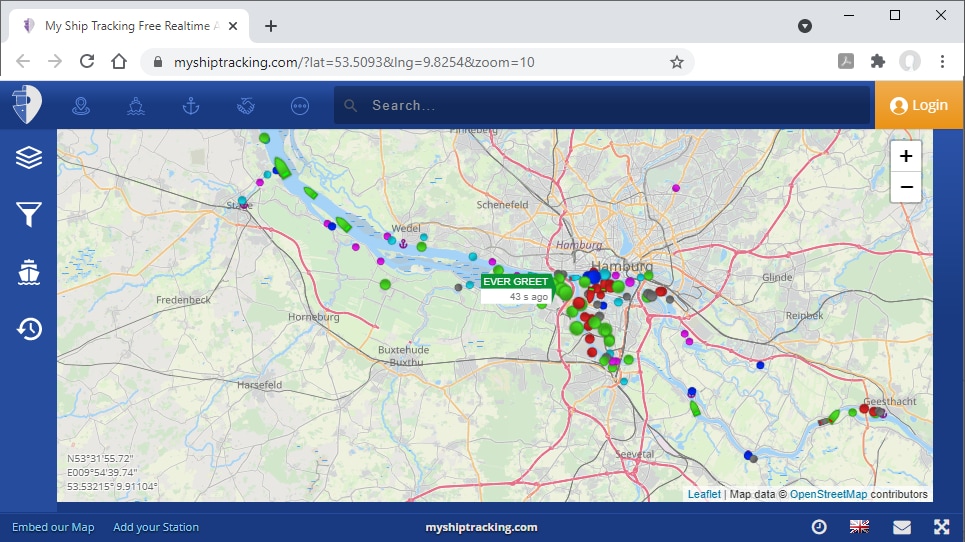
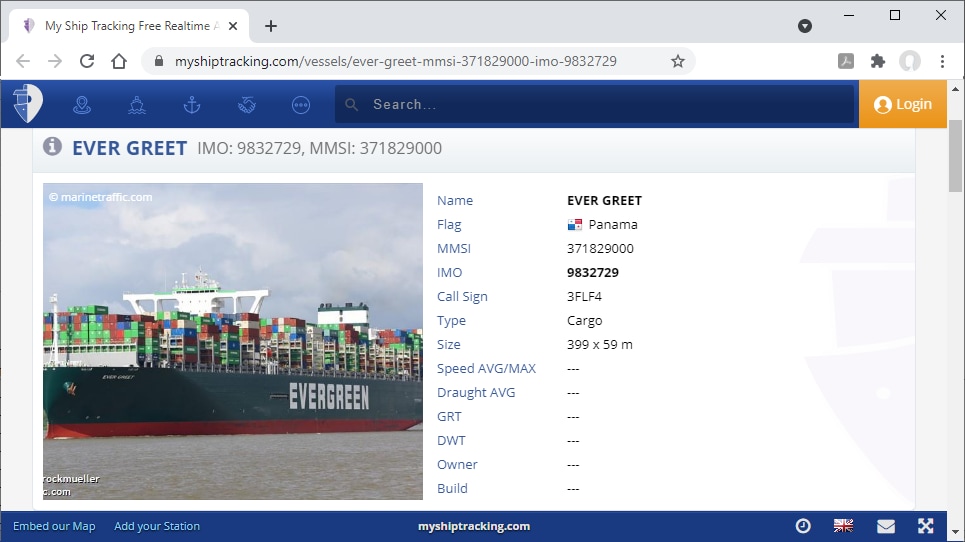
The red dots represent tankers and the green dots are cargo ships. We can click any dot for details on the vessel:
Catch up with the original post on Web service integration, watch a quick video demo of MapForce, or download a free trial including Tutorials, Help, and many more examples to get started with your own project for API data mapping, or other data integration, conversion, and transformation tasks!