XPath Enhances XML Reports
In our previous post on Creating Elegant Reports for GPS XML Data we used an XPath expression to select nodes from an XML document for an elevation line chart. You can also use XPath to compute values. Altova StyleVision includes strong support for XPath, and we can write XPath expressions to add interesting information to our GPS XML reports. For instance, we can process the elevation data stored by the GPS device in meters to plot a chart showing the elevation in feet above sea level instead.

The conversion formula for meters to feet is (meters x 3.2808399) = feet. We can apply this calculation in the Chart Configuration dialog:
Now the chart will be drawn using the results of the calculation performed on data retrieved from the source file.
XPath Time Functions
You may have noticed our chart does not include a definition of the X-axis scale. We deliberately eliminated tick marks and values from the X-axis because GPS devices store trackpoint information every few seconds. The file for the ice-climbing hike has more than 1,800 elevation data points and the sheer volume of data points created a series of tick marks that merged into a solid line! There wasn’t enough room for the values text either.
But wouldn’t it be interesting to know how long the hike took? We can insert that fact into our report by taking advantage of StyleVision Auto-Calculation. The portion of the design below shows three Auto-Calculation elements added to the report via the Insert / Auto-Calculation / Value menu option and enhanced with descriptive text.

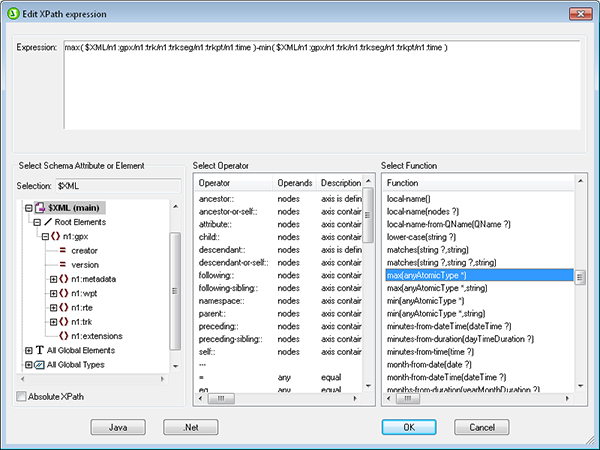
Right-clicking any Auto-Calculation element opens a menu that provides access to the Edit XPath dialog illustrated below in reduced size. You can type an XPath expression directly into the window, or construct one by choosing from the Element, Operator, and Functions lists.
To calculate the elapsed time for the trip we can use the XPath functions max(anyAtomicType) and min(anyAtomicType) with XPath expressions for the <time> elements for each trackpoint to find the earliest and latest times recorded in the track. We can subtract the earliest time from the latest time to calculate the elapsed time.

Another selection in the Auto-Calculation right-click menu opens the Value Formatting dialog for instant access to a variety of formats appropriate for the data type of the calculation result.

We could also use the min( ) and max( ) functions to select the Departure and arrival Times, but the data stored by the GPS device is in GMT time and this hike took place in Eastern Standard Time in the United States, where the local setting is five hours earlier.
Fortunately, XPath includes a special function adjust-dateTime-to-timezone( ) to adjust a dateTime value to a different time zone. Here is the expression we used to adjust the departure time:
adjust-dateTime-to-timezone( min( $XML/n1:gpx/n1:trk/n1:trkseg/n1:trkpt/n1:time ), xs:dayTimeDuration(‘-PT5H’) )
Note that we must enter the adjustment duration as a string and explicitly declare it as a dayTimeDuration data type.
We can use the Value Formatting dialog to present the departure and arrival times in a familiar style:

We have one more XPath enhancement for our GPS XML report. In our earlier post, we described a technique to use a StyleVision Project and standardized file names to generate reports for multiple data files without modifying the SPS file. You can also use the StyleVisionBatch utility, or even the StyleVision API to automate processing through SPS stylesheets to create reports in a variety of formats.
Chart File Names
When we generate and save HTML output, the main report is an HTML document and charts are separate image files. We can specify the chart file name in the Chart Settings dialog, but if we want to save multiple HTML reports in the same folder on a server, we will need different file names for each chart. Otherwise, each new chart will use the default name, overwriting the previous version.

The Custom file name option lets us use an XPath expression to specify a different image file name. One simple solution might be to generate a random number, convert it to a string, and insert the string into the file name.
But we can’t do that because XPath does not include a random( ) function.
Instead, we can generate a pseudo-random string by combining two additional XPath time functions. The function seconds-from-time( ) returns seconds and milliseconds from any value, and current-time( ) returns the current system time in hours, minutes, seconds, and milliseconds.
We can seed seconds-from-time(current-time( )) into an XPath expression in the Image file settings dialog to plant a file name based on the exact second and millisecond the HTML result is generated. The complete XPath expression to generate the file name string looks like this:

When we save the generated HTML output, StyleVision reports all additional files created with the main document:

Route Map Image File Names
When we create multiple HTML pages for trip reports, we will also need to reference a different route map image for each trip. XPath can help with this task too. We initially inserted the map using a specific filename URL, but instead we can define an image filename as a parameter to be supplied when the stylesheet is processed.
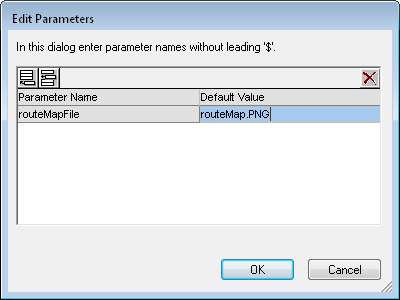
The Edit / Stylesheet Parameters menu option opens the Edit Parameters dialog, providing centralized access all parameters for the stylesheet. In the screenshot below, we added one parameter named routeMapFile and defined its default value.

Now we can use the parameter to assign the route map file. The Edit Image dialog includes four options to define the location of an image. In the screenshot below, we chose the Static and Dynamic tab for a specific folder path and a dynamic file name.

We can supply a new value for the routeMapFile parameter when we generate a report in any output format. If we don’t supply a new value, the default defined in the Edit Parameters dialog is used.
Now we can write a command line to execute StyleVision in batch mode with a different route map image:

We could also use a parameter to assign the chart background. Another command line option can even select a new input XML file to replace the working XML defined in the stylesheet. Parameters and command line options make StyleVisionBatch a great way to use the same stylesheet to generate reports for many different data sets.
Here is the HTML preview of the ice climbing trip data with all our XPath enhancements applied:

To design your own reports based on GPS XML files, or to elegantly achieve any other XML reporting, e-forms, or multi-channel publishing requirement, click here for a free trial of Altova StyleVision.

Editor's Note
The working data mapping files and stylesheets described in this post are available for download at http://www.altova.com/documents/AltovaBlogExampleFiles.zip so you can work through the same examples for yourself.
See Download Example Files for FlowForce Server, MapForce, and StyleVision for more info.