XML Grid Gets a Makeover
If you’ve worked with XML in XMLSpy you’ve likely utilized XML Grid View to get a graphical representation of your XML document’s structure. This visual representation of the document’s hierarchical structure makes it immediately easier to understand and edit the content.
In the latest version of the XML editor, XML Grid looks a little different – in fact, it’s been completely rebuilt from scratch to offer even more unique functionality for editing, querying, calculating, and sharing XML data.
New XML Grid view
Starting with Version 2021r2, the rebuilt XML Grid is even easier to use and offers powerful new options and functionality. For instance, XML Grid now includes SmartFix XML validation, which detects errors This detects validation errors and offers solutions for fixing them.
The editor still includes the familiar table view that rearranges repeating elements in a table for easy viewing and sorting, using attributes and child elements for the columns and showing repeating XML element as rows.
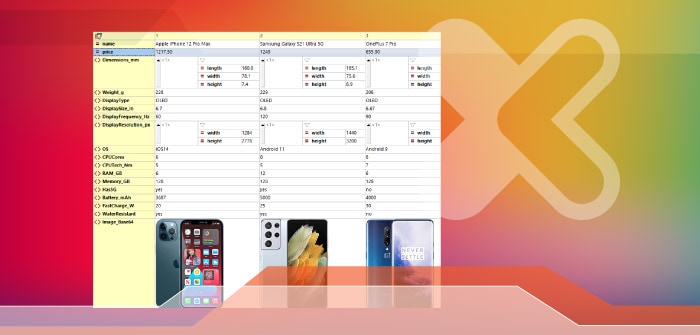
What’s new is that rows and columns in the table can now be flipped to rearrange the display of the document to make it even more human-readable. For instance, table comparing mobile phones below has many columns but few rows.

Flipping the rows and columns makes the content immediately accessible.
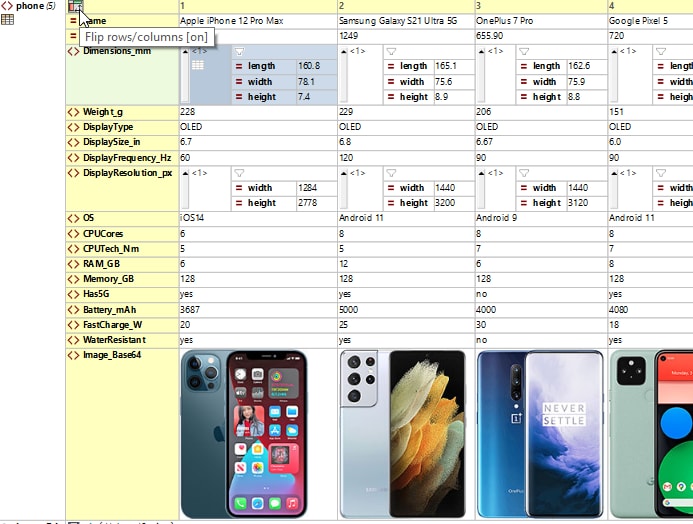
Viewing Base-64 images as graphics
XML Grid View now supports automatic viewing of images (like the mobile phone shots shown above), including PNG, JPG, BMP, SVG, and animated GIFs – which is of course not possible in a text view.
You can even copy an image directly from an image editor and paste it into XML Grid View. Images are stored in base-64, which can be seen by switching to text view.
Adding content directly from external applications
In addition to copy/pasting images, you can easily copy content to or from external applications and its structure will be automatically detected in XML Grid. For instance, you can select content in Excel or a text editor and drag it directly into XML Grid.
Filters
One of the most compelling aspects of the new XML Grid View is that it lets you take advantage of XPath and XQuery to filter and process data directly in the view.
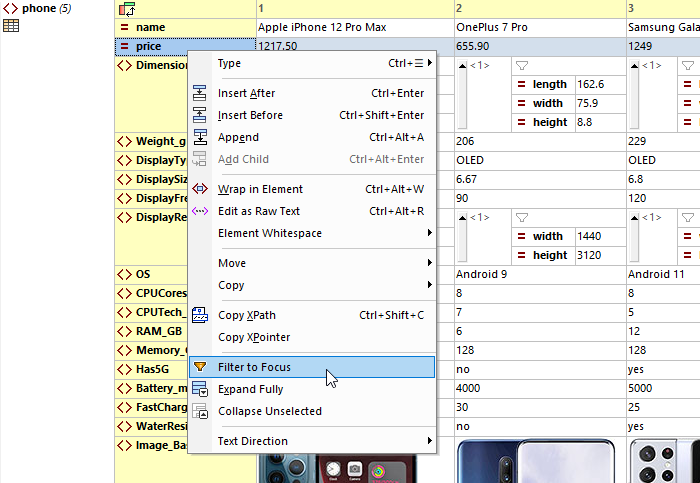
The right-click context menu helps you get started creating filters quickly – when you select the Filter to Focus option, a filter is automatically created to display the selected node. Then you can expand the filter to include exactly the required criteria. This is faster than starting from scratch and gives you a hint about how to structure the filter.
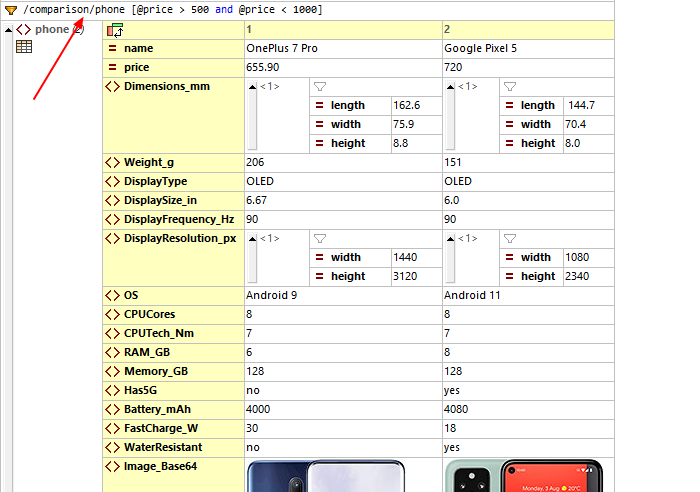
Below we’ve created filter to narrow the display to phones in a particular price range, and the result returns two phones. The filter can be toggled on or off as needed.
Formulas
While filters simply change the display of content in XML Grid View and do not modify the underlying XML document, formulas composed with XQuery can be used to calculate a result or generate a nodeset that can be stored in the document.
To define a formula, add a new node and use the in-cell Type button to change the type to Formula and enter an XQuery expression. Here’s a formula that calculates the average price of the phones in our document.
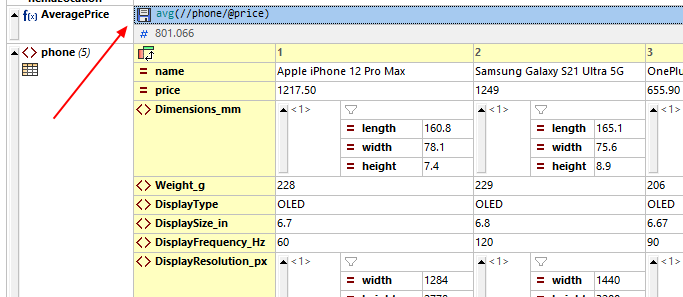
Clicking the disk icon will save the formula as a processing function and the result as a new element in the XML file itself.
Charts and graphs
XML Grid even lets you define charts and graphs to visualize numerical data directly in the editing view using the altovaext:chart XQuery extension. Below is a chart of phone prices in the XML document.
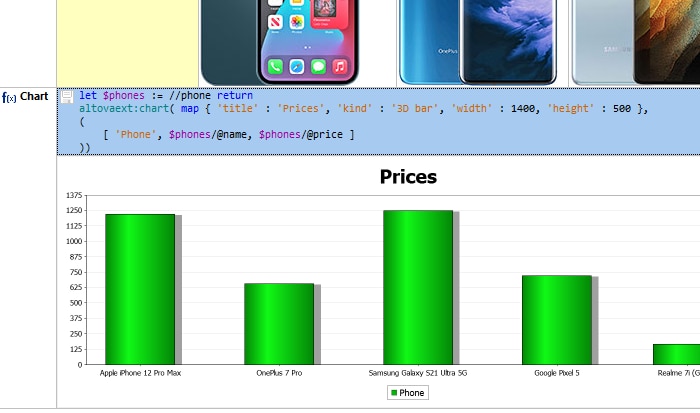
Once generated you can save the chart with the file, copy the chart image, or copy the chart as XML data.
Check out the demo video below to see these new features in action.