Tag Archive for: xml reports

Build Advanced XML Reports with New XPath Debugger


Altova StyleVision is a unique, easy-to-use tool for creating business reports using a drag-and-drop visual design interface. StyleVision lets you build reports for XML as well as database and XBRL sources. Each design you create can be automated for recurring reporting to HTML, PDF and Word, either using the auto-generated XSLT stylesheet or via StyleVision Server.

Integral to XSLT stylesheet design is XPath for selecting and calculating data, as well as defining styling rules, in your report. New features added to StyleVision include an XPath debugger that makes testing and perfecting your report easier than ever. Let’s see how it works.

Developer working from home
Read more…
Tags: , , , , , , ,

XPath Expressions for Data Reporting


In our earlier post titled Use XPath Expressions to Refine Data Selection, we described how to use XMLSpy to develop an XPath expression to select one table of data contained in a much larger data set provided by the US Department of Education.

An HTML report based on XPath data selection in StyleVision

We can reuse the work in XMLSpy to quickly create a StyleVision design for a report or an e-Form to communicate highlights from the data.
Read more…

Tags: , , , , ,

Data Exchange for the Mobile Workforce


Data Exchange for the Mobile WorkforceOrganizations have been forced to adapt many of their internal business processes to accommodate an increasingly mobile workforce. Although there are technological solutions that address many of today’s communication needs, the plethora of different document formats in use – even within the same organization – means that some tasks remain vexing. For example, how does an organization remain flexible enough to facilitate the exchange of data among mobile workers yet retain the ability to bring that data into internal IT systems? Altova offers an inexpensive solution with StyleVision®, a graphical stylesheet and report designer with electronic forms capability, and Authentic®, a WYSIWYG XML and database editor in which end users can view and edit electronic forms created in StyleVision. The Authentic Community Edition is available from the Altova Web site as a free download so that anyone can be brought into your workflow, whether they are internal or external to your organization.clip_image002In this post we’ll present a sample case showing you how to create an electronic form that mirrors an existing paper form (in our example it is a reimbursement form) and then we’ll follow it as it makes its way around a fictional organization. Please note that the example we use here is simplistic and was designed only to illustrate the process of developing and deploying an electronic form. Although you can add additional data sources and perform validation and other complex functions in StyleVision, we have not illustrated these here.It is extremely easy to design electronic forms in StyleVision. To start, we simply select New – New from XML Schema/DTD/XML … from the File menu, browse to an XML Schema file, and select the type of design we’d like to create. For this example we created an XML Schema and instance file in XMLSpy, Altova’s XML editor and development environment, based on the fields on the paper reimbursement form. You can also base a StyleVision design on a database or XBRL taxonomy.Below is a copy of the reimbursement form we will be using along with the XML Schema we created.clip_image002clip_image003Once we select the XML file in StyleVision, we are prompted to select either a free-flow or form-based document. In a form-based document all design elements (e.g., text boxes for user input, images, buttons) are fixed in position – ideal for data entry forms.When we create a form-based document, we can upload a “blueprint image” so that we can recreate a paper-based form exactly as it was originally designed. This is the option we’ve selected below. The image will appear in the background of the design window and we will simply place design elements on top of corresponding elements on the form. Of course, the blueprint image overlay does not appear in the final output.clip_image004The screenshot below shows the blueprint image as it appears in the design window in StyleVision – how cool is that? clip_image005Now, using the Insert menu at the top, we can simply insert design elements onto the blueprint image in the design window.Available design elements include form controls (e.g., input boxes, combo boxes, radio buttons), images, tables, charts, and “layout containers” for exact positioning.We’ll start by adding input fields to capture employee information (i.e., First [Name], Last [Name], Title, etc. from the top part of the form). Once we click Insert – Insert Form Controls and select Input Field, the Insert Design Element dialog box appears.We have highlighted the First [Name] element in the dialog box below – the input field will now be associated with the First element. This way, when the end user types data into the input field and saves the form, this information will populate the First [Name] element in the XML file.clip_image006We now add design elements throughout the rest of the form, associating input fields with their respective elements from the XML file.When we are finished adding input fields, a logo, lines, a table for the expense items, and labels, the design looks like this – we’ve set the opacity attribute for the blueprint image to 0 to make it easier to view the design elements. Please note also that we’ve done some additional design work such as adding calendars in date fields, drop down boxes, and a currency sign that changes according to user input. For more information about fine tuning your form please see the StyleVision User and Reference Manual in the StyleVision application.clip_image007We can preview how the end user will see the form we designed in StyleVision by clicking on the Authentic eForm tab at the bottom of the design window (below). Note that the end user is prompted to enter data directly into each data input field. We accomplished this by placing the prompts (e.g., Insert First Name) in between the relevant tags in the XML file associated with our design. The end user simply highlights the prompt and replaces it with text.clip_image008Once we are finished designing the reimbursement form we can save the entire design – including the XML Schema and instance files, images, and any other associated files – in a single PXF® (Portable XML Form®). Saving the design as a PXF will enable us to email the form along with data updated in the underlying XML form among people both inside and outside the company’s LAN.clip_image009Once we hit OK we are prompted to select the files to include in the PXF. Notice that we’ve selected HTML, RTF, PDF, and Word 2007+ under the Generate and store XSLT files … heading. This will allow an end user to generate the form – with data – in these formats directly from Authentic.clip_image010Now that we’ve saved it in a PXF, the electronic form we designed in StyleVision is ready to be deployed in a business environment.In our example, we have a team of salespeople working across the globe who need to request reimbursement for business and travel expenses incurred. The salespeople complete expense reports, forward them to their managers for approval, and then send approved reports to the corporate office so that the information can be added into the accounting system.The PXF makes this easy.Once a salesperson is ready to complete a reimbursement request, she simply opens the PXF in Authentic and can immediately begin entering information onto the form. Below is a screenshot of a reimbursement form that has been completed in Authentic – notice that the form still needs a manager’s signature.clip_image011Now the salesperson must send it to her manager for approval. It’s easy to initiate an email with the form attached directly from Authentic. clip_image013Once the manager receives the email, she can simply double click the attachment and it will open in Authentic. Here the manager has clicked the Approved check box and added her name and the date.clip_image014The manager can then email the updated PXF back to the salesperson, who in turn emails it to the corporate office so it can be imported into the accounting system for processing. Our fictitious corporate office of course receives hundreds of reimbursement requests each day and has established a process for importing them into the relevant Oracle databases in the accounting system.We’ll use Altova MapForce, a graphical any-to-any data mapping, conversion, and transformation tool, to populate the corporate database with the data from the quotations. After setting up the mapping, we’ll automatically generate code from MapForce so that we can automate the transformation either through batch processing or a real-time conversion.First we’ll set up the mapping.We’ve inserted the XML file ExpRpt which we’ve extracted from the PXF into the left side of the MapForce design window and then inserted the Oracle database on the right side of the design window.Now we can drag and drop fields from the XML file with the reimbursement data into the Oracle database. We can also transform data, as we’ve done with the Approved element. Here we’ve used the built-in boolean function to convert the string value stored in the XML file (“true” or “false”) into the numeric equivalents (1 or 0). We can also create our own functions.The mapping we’ve created appears below.clip_image015Please note that this post offers a very broad overview of how to use both StyleVision and MapForce. Please visit the online training section of the Altova website for more in-depth instructions on how to use these and other Altova products.And there you have it. With the PXF, the fictitious Nanonull Corporation allows a group of far flung sales reps and their managers to easily exchange and edit information via electronic form. The PXF also provides a way for Nanonull to populate the accounting database without offering these employees direct access to company IT systems. All without busting the IT budget.

clip_image016

What could your organization do with a flexible, portable interactive document? Please share your ideas with other users by commenting on this blog post. Have you used StyleVision or other Altova products in an interesting project and think it would make a great case study? Email us at marketing@altova.com. We’d love to hear from you!

Tags: , , ,

Leverage Your Financial Data with the XBRL Chart Wizard–Part 2


Extensible Business Reporting Language (XBRL) is an XML-based language for reporting and exchanging financial data that’s making inroads across the globe. In fact the US Securities and Exchange Commission now requires public companies to submit financial data in XBRL format.Altova’s MissionKit, a suite of our most popular software, supports XBRL tagging via XMLSpy and MapForce as well as XBRL rendering via StyleVision. With StyleVision you can create sophisticated financial reports including charts and tables based on XBRL instance files. image This is the second post in our two part series on StyleVision’s XBRL chart capabilities. In our last post we showed you how to call the XBRL Chart Wizard and create pie charts. This time we’ll show you how to create bar charts and line charts. Bar Charts Bar charts are the ideal vehicle for comparing groups of objects or visualizing change from one period to another. Here we’ve used the XBRL Chart Wizard to create a bar chart comparing Current Assets to Current Liabilities from the third quarters of two consecutive years. After invoking the XBRL Chart Wizard as we did in the very first step, we select Current Assets and Current Liabilities in the Concepts tab and place it in the Series pane so that these amounts will be reflected on the Y or vertical axis. clip_image001 Now we click the ellipses in the Period tab in the Categories pane to bring up the Period Properties dialog box. Assets and Liabilities are measured at specific points in time and so we have checked the Show instant periods box. We’ve also filtered the data using XPath so that only assets and liabilities at the end of the third quarter (which ends in August) appear. Finally we add a dynamic label that combines “Q3” with the year using XPath. clip_image002 In addition to the bar chart, we’d like to include the Quick Ratio, a measure that indicates whether an organization has enough readily liquidated resources to cover outstanding financial obligations. The Quick Ratio is simply Current Assets divided by Current Liabilities. We’ve added an auto calculation and used XPath to divide Current Assets by Current Liabilities for all time periods in the XBRL instance document. Below is the design view of our bar chart and auto calculation, including the XPath. clip_image003 The HTML output appears below. However we can also render the design in RTF, PDF, and Word 2007+. clip_image004 Line Charts A line chart has a line connecting discrete points plotted on a graph and is typically used to track how financial and other data varies over time. In this example we’ve created a line chart to track two concepts – costs / expenses and revenue – over a four year period. Just as we did for the pie chart and bar chart, we’ve dragged a concept (here, Revenues) from the Schema Tree into the design window and invoked the XBRL Chart Wizard. Likewise, once the Chart Wizard opens, we clicked on the ellipses on the Concepts tab in the Series pane to bring up the Concept Properties dialog box, where we selected the Costs and Expenses concept. Costs and Expenses will now appear on the chart along with Revenues. Our XBRL file includes both instance and duration time periods so in the Period Properties dialog box below (invoked by clicking on the ellipses in the Period tab in the Categories pane) we’ve selected only duration periods, or those with a start and end date. We will now use XPath to filter the data. We’ll create a variable $altova:duration that translates the difference in number of days between the start and end dates of the period into the number of months and then selected data where that variable is equal to three (equivalent to a fiscal quarter). We’ve also used XPath to create a dynamic label combining Q3 with the year. clip_image005 Because our line chart is visualizing changes in revenue and costs and expenses over time, we have used the Sort function in the Period Properties dialog box above so that the data appear chronologically. clip_image006 Although the appearance of the chart (e.g., colors, labels, and visibility of tick marks and axis values) can be controlled with the All Settings button in the Chart Settings section of the XBRL Chart Wizard dialog box, it can also be controlled with XPath via the Dynamic XPath Settings button under Chart Settings (below). clip_image007 This feature provides tremendous flexibility not only in managing appearance but in managing the contents of the chart. Among the many things you can do with XPath are controlling output based on conditions and adding a dynamic title that includes the time period reflected as we’ve done here. Once you click the Dynamic XPath Settings button in the XBRL Chart Wizard dialog box (above), the Dynamic XPath Settings dialog box is invoked (below). clip_image008 Clicking the ellipses next to the property that you want to edit in the Dynamic XPath Settings dialog box (above) brings up the Edit XPath Expression dialog box (below). Here we’ve used XPath to concatenate a string (“Revenues / Costs and Expenses”) with the first and last years in the period we identified in the Period Properties dialog box earlier. clip_image009 The XPath expression entered here will overrule the settings in the Change Appearance and XBRL Chart Wizard dialog boxes – notice in the chart (here rendered in HTML) includes the dynamic title that we built with XPath rather than the title in the XBRL Chart Wizard Dialog Box. clip_image010 As we’ve shown here, the XBRL Chart Wizard provides developers and designers with a highly flexible tool for visualizing XBRL data. With XBRL’s place in the international technology sector firmly established, the ability to leverage XBRL data to support strategic decision making is key. There are a number of different types of companies that are discovering the strategic value of XBRL. Our XBRL case study describes how the Maryland Association of CPAs streamlined their tax reporting and benchmarking processes with XBRL. This case study is a great resource for anyone interested in learning how to leverage this data with Altova software tools.

clip_image011

Have you created something really great with the XBRL Chart Wizard? Or developed an interesting project using StyleVision or another of our tools? Please share your story with other Altova users by commenting on this blog post. Think it would make a great case study? Email us at marketing@altova.com – if we choose to use your story you’ll receive a $200 Amazon gift card as well as some free press for you and your organization. We’d love to hear from you!

Tags: , , ,

Advanced Presentation and Formatting in StyleVision


The StyleVision stylesheet and report design tool has added a plethora of advanced functionality over the past several releases. In this post we’ll explore some of the advanced presentation and formatting capabilities that make this tool so powerful. Data visualization (e.g., charts and graphs) and other graphical elements are de rigueur these days. Whether it’s showing change over time via a simple bar graph, highlighting performance with an image from the art department, presenting market data with a candlestick chart or developing a gauge for dashboard reporting, organizations today demand the ability to include sophisticated graphics on all sorts of output – including Web sites. Altova StyleVision 2011r2 can help you meet these demands with advanced presentation and formatting capabilities. You can use StyleVision to generate graphical representations of XML, database, and XBRL data for output to eForms, PDF, HTML, RTF, and Word 2007+. Advanced formatting capabilities will enable you to create impressive charts, graphs and other data views that resonate with audiences. In addition to 2D and 3D bar and pie charts, you can create line, area, candlestick, and gauge charts for use on Web sites or printed materials. Overlay reports provide you with the ability to juxtapose two data sets such as opening, high, low, and closing share prices (candlestick chart) with daily share volume (bar chart) as pictured here. Create Overlay Reports with StyleVision Comprehensive style attributes including colors, background images, legends, and even dynamic XPath settings provide you with complete control over how XML, database, and XBRL data are presented. Among pie chart attributes StyleVision users can select from, for example, are start angle, drop shadow, tilt (for 3D), color scheme (including user defined), and visibility of values, percentages, labels and legends. Create Advanced Pie Charts with StyleVision Adding background color and images is easy with drop down boxes – to achieve the yellow vertical gradient pictured in the overlay chart below simply go to All Settings under Appearance in the Chart Configuration dialog box, select Background Color in the Plot section of the General tab and select vertical gradient and the yellow color swatch from the drop down boxes.Advanced Charting with StyleVision StyleVision even offers users the ability to design templates so that output can be modified dynamically based on end user input. Below is an eForm that presents information in English and German depending on which button is toggled – conditional statements associated with a variable declared at the $XML template control this. Please note that the formatting in the Date field changes as well. Design Forms in Multiple Languages with StyleVision Design Forms in Multiple Languages with StyleVision Keep in mind that any form that you would like to reproduce in StyleVision can be imported as a “blueprint,” a configurable image that serves as a template. This allows the designer to place text, input fields, and other design elements directly on the template and makes it easy to build an eForm identical to the original. With advanced presentation and formatting for charts and graphs Altova significantly extends the capabilities of StyleVision’s already powerful report builder – your designs are limited only by your imagination. clip_image008 We’d love to hear how you are using these or other capabilities in developing your own projects. Please share your stories by posting to our Facebook wall or commenting here on our blog! If you haven’t tried StyleVision before, now is the time. Download a free, fully functional, 30-day trial from the Altova Web site now.

Tags: , , ,

New Software Release : StyleVision 2011


On September 8, Altova released v2011 of the MissionKit with the addition of powerful reporting functionality across many of the products. Specifically, StyleVision has been supercharged with a multitude of new features, securing its place as an advanced and versatile business intelligence application, priced for today’s market. Let’s take a closer look at the exciting new features in StyleVision 2011 including:

  • Charts as a new design element
  • Chart wizard for XBRL files
  • Explicit support for HTML/CALS tables
  • Ability to import existing XSLT files
  • Scripting & toolbar editor for Authentic®

Charts as a new design element StyleVision joins other MissionKit 2011 tools with support for charting, adding to its already advanced general purpose reporting capabilities to create a highly scalable decision support tool for XML, database, and XBRL content. As with all StyleVision designs, charts can be easily rendered for multi-channel output in HTML, RTF, PDF, Word 2007+, and electronic forms. The following types of charts are available:

  • 2D & 3D pie charts
  • 2D & 3D bar charts
  • Category line graphs
  • Value line graphs
  • Gauge charts

The chart configuration dialog lets you use XPath to select data for your charts. This can be as simple or as complex as you want, running the gamut from database data that is already laid out in a tabular format to XML files where the nodes you need to select are spread out over hundreds of lines of code. Pssst… if you’re thinking that this would be great for the unique demands of XBRL, read on because we created something special with that in mind ;). Here are a couple of examples of charts that you can build in StyleVision: clip_image001 clip_image003 Yup, you can even chart completely different sets of data on the same graph. How creative you want to get with your visual analysis reports is really up to you. You can even create interactive charts for use with Authentic – allowing end users to manipulate eForms to view the desired result. For example, the screenshot below shows the Authentic view of a pie chart where a drop-down menu (combo box) selection dictates the subset of data that is represented. clip_image005 Charts are easily integrated into your StyleVision report templates at any point by simply dragging the relevant node onto the design pane and choosing Insert Chart from the context menu. The Chart Configuration dialog can then be used for chart settings (choosing chart type and style) and data selection (populating your chart axes with the relevant data from the source). clip_image007 You can even use Dynamic XPath Settings to apply transactional data to your chart. Of course, if you sometimes have trouble telling your .s from your /s, you can always get some help with more complex expressions from StyleVision’s XPath Builder. Chart wizard for XBRL files If you are familiar with XBRL, you are intimately aware of the complexities associated with navigating XBRL taxonomies. And, if you’re impressed with what you’ve just read about StyleVision’s charting capabilities, you are probably trying to remember where you put that old XPath reference guide. Not to worry! StyleVision has added to its XBRL rendering support with an XBRL Chart Wizard that lets you easily select data and define presentation settings for your XBRL reports. clip_image009 Concept and Period Properties dialogs are included to let you specify which elements should be included and how periods (instants or intervals of time) should be handled in your chart. Explicit support for HTML/CALS tables StyleVision now provides direct support for HTML/CALS tables, meaning that it will automatically recognize values dictating table structure (column number, row height, etc.) and apply them to rendered output. (v2011 adds support for rendering HTML/CALS tables in HTML, RTF, PDF, AND Word 2007+ – previous releases have supported output to Authentic eForms.) clip_image011 You can also easily assign additional presentation styles to HTML/CALS tables using the Edit CALS/HTML dialog. clip_image013 Ability to import existing XSLT files Well, I’m sure a few of you were hoping that this one was coming soon… You can now base your StyleVision template designs on existing XSLT files that were designed for HTML output or XSLT files with XSL:FO commands that were designed for output to PDF. Simply choose the New from XSLT File option and presto change-o, your design will be fully manifested in the design pane. Now you can edit your template using StyleVision’s graphical interface and output to even more formats (HTML, RTF, PDF, Word 2007+, and Authentic eForms) with just the click of a button. Scripting & toolbar editor for Authentic This feature is just way too cool not to devote an entire post to it, so keep your eyes peeled for a full description coming up on this blog. In the meantime, check out the Authentic scripting page for a brief description and examples. Better yet, just download a free 30-day trial of StyleVision today to test drive all of these new features for yourself!

Tags: , , , , , , ,

Altova MissionKit 2011 is Now Available!


MissionKit Version 2011 Reporting Tools 
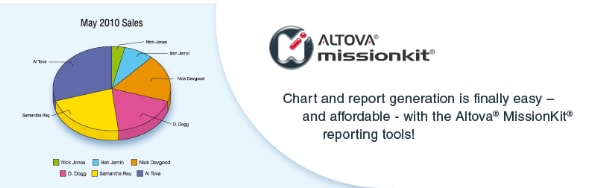
The Altova team is excited to announce the release of Version 2011 of our MissionKit tool suite and entire product line. This release delivers a multitude of innovative features, including robust chart and reporting functionality for analyzing and communicating XML, database, XBRL, EDI – virtually any type of data – in a meaningful, eye-catching way. Charts are created with a few clicks inside MissionKit tools and can be immediately shared via copy/paste or saved as image files – that’s right, no more exporting to Excel – or integrated in reports or data entry applications designed in Altova StyleVision. Of course, you can also get the XSLT or XQuery code for generating the chart for use in your own apps. The MissionKit 2011 includes a wide range of other new features– like SOAP validation, schema flattening and subset creation, database UML diagrams, and more – and we’ll cover all of those subsequent blog posts. For now let’s focus on the new charting and reporting features across the Version 2011 MissionKit.

CHARTS

Charts can now be generated and used in the MissionKit 2011 XML and database tools in a variety of ways. The following types of charts and graphs are available for providing a graphical representation of numerical data:

  • 2D & 3D pie charts
  • 2D & 3D bar charts
  • Category line graphs
  • Value line graphs
  • Gauge charts

Charts are fully dynamic and can be automatically or manually regenerated when backend data is updated. XMLSpy You can create a new chart directly in the XML editor by simply highlighting a range of data in either Text View or Grid View and selecting New Chart from the right-click context menu. Bar chart from XML data 
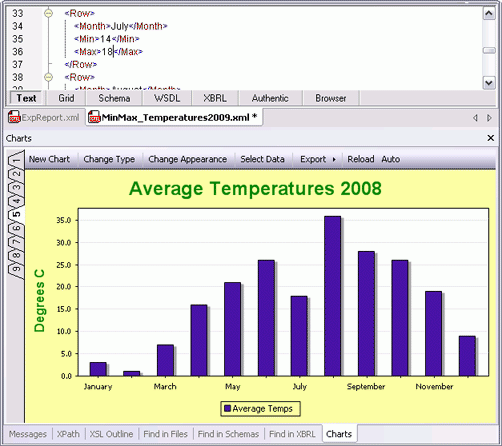
The chart’s appearance, labels, and so on, are highly customizable, and your finished chart can be printed, copied to the clipboard, saved as an image, or – and this is truly unique – exported as XSLT or XQuery code for use in your own stylesheets, reports, or apps. Line graph from XML 
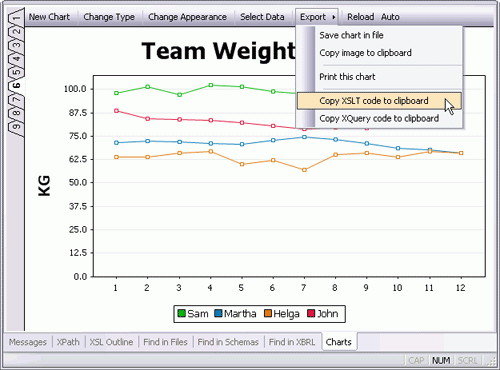
XMLSpy is the first and only XML editor on the market to support this powerful functionality, giving our users a distinct advantage when it comes to analyzing and interpreting XML data. You can also create a chart to visualize the results delivered by the XMLSpy XSLT Profiler and XQuery Profiler, making it easy to interpret and communicate performance data. StyleVision Charting and graphing support in StyleVision 2011, the stylesheet and report design tool, allows you to present data in a powerful, visual way, so that it can be easily analyzed from a variety of different angles. When you’re creating an XML, database, or XBRL report (or even a data entry form for use in Altova Authentic), it’s easy to specify your chart parameters via XPath and then customize the appearance of your chart or graph. Report builder with chart 
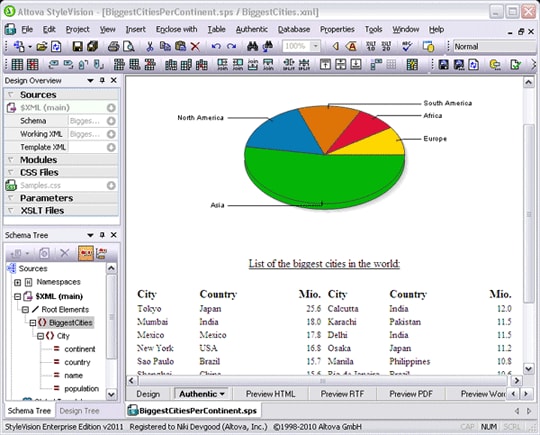
You can even utilize dynamic XPath settings to apply dynamic data from your source to the settings of your chart. For example, if you have a chart that shows regional data, you may wish to reflect the name of each region in the title of your chart. If there are several Region elements, the data for the chart title can be selected dynamically via an XPath expression depending on which set of data is being presented in the chart. Charts are integrated in multi-channel StyleVision reports, described further below. DatabaseSpy Relational database data often lends itself perfectly to a graphical representation, but it’s not always easy to create charts to analyze relationships locked away in database tables. Now, with DatabaseSpy 2011, it’s as simple as selecting the column(s) you wish to chart. Chart of database data 
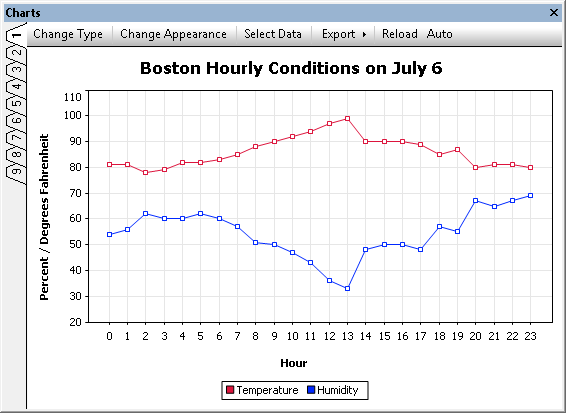
You can even generate and save charts based on calculations performed in a SQL query – such as averages, percentages, etc. As with XMLSpy, charts may be saved as image files, printed, and copied to your clipboard. DatabaseSpy supports all major relational databases, and even with this charting functionality and its other advanced tools, it’s ridiculously affordable.

REPORTS

StyleVision The new chart creation functionality described above adds a whole new level of sophistication to Altova’s general purpose reporting tool, StyleVision. While you’ve been able to design attractive XML, database, and XBRL reports in previous versions of StyleVision, now you can also include dynamic charts for full featured, multi-channel reporting in digital formats like HTML and e-Forms, and print media including Word and PDF. Advanced options such as drag-and-drop design, absolute positioning, modular designs, conditional templates, support for importing and/or reusing existing XSLT stylesheets, dynamic data selection, and more, combine to make StyleVision robust solution for business reporting on any scale. Report builder / report tool 
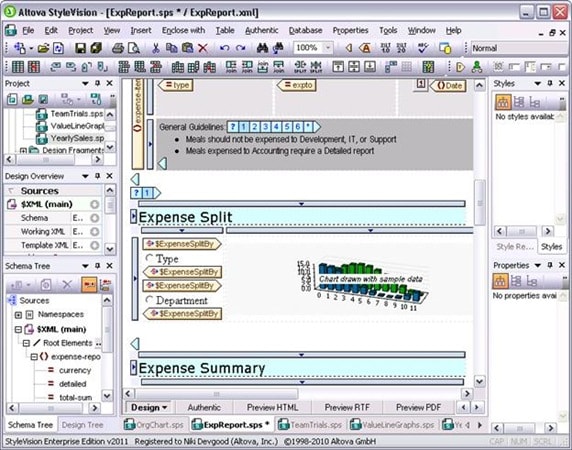
In fact, StyleVision now integrates with MapForce – so you can design reports for virtually any type of data. MapForce Starting with Version 2011, MapForce supports integration with StyleVision, allowing MapForce users to automatically render results of their XML and XBRL mappings using an associated StyleVision report design. This very powerful feature essentially combines MapForce’s any-to-any data mapping capabilities with a sophisticated rendering engine, meaning that you can now automate chart and report generation from virtually any data format – including databases, flat files, Excel, EDI, and more – that can be mapped to an XML Schema or XBRL taxonomy. Chart of mapped data

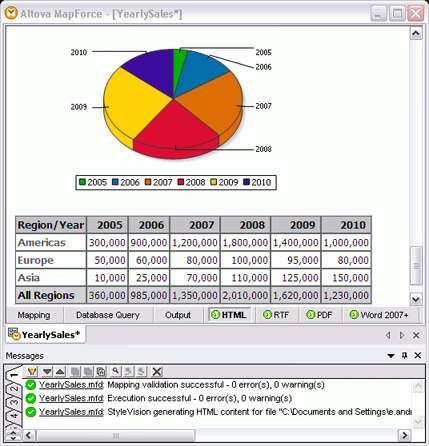
DOWNLOAD VERSION 2011

Whether you need to generate charts while working with XML or databases, or you need to design full-featured reports with dynamic, multi-channel output, we hope you’ll check out the new MissionKit 2011. Then, post a comment here on the blog to let us know what you think! Upgrade or Download a Free Trial See more details and screenshots, or download Version 2011 now. Current customers with active support and maintenance can download the new version for free. A fully functional 30-day trial is also available.

STAY TUNED…

More details about all the new features added in Version 2011 will be posted in the coming days.

Tags: , , , ,