Tag Archive for: XML charts

Automate Data Mapping and Transformation with FlowForce Server


Altova FlowForce Server, launched on April 29, 2013, includes numerous enhancements over earlier beta releases and one of the most exciting new features is the implementation of StyleVision Server. Now a FlowForce Server job can automate a complete data transformation workflow by executing MapForce Server for data mapping and pipelining results to StyleVision Server to render a variety of output formats.This post describes a straightforward FlowForce Server mapping and transformation job as illustrated in these messages from the FlowForce Server Log, with the most recent step at the top of the list:

FlowForce Server Job Log showing MapForce Server and StyleVision Server job steps

We’ll start with the GPS log files created by a digital camera. We wrote about these files last January in the post titled Process Multiple Input Files in a Single Data Mapping. We’ll use the mapping output with a StyleVision SPS stylesheet adapted from the XPath Enhances XML Reports post to produce a time and elevation report for each file.A FlowForce Server For-each job step repeats based on the result of an expression. We can use For-each to build a list of files in a folder, then repeat one or more steps for each file. Here is how it looks in the job configuration page:

FlowForce Server data mapping job step

The line labeled Execute function defines the mapping to be used by MapForce Server, and the input parameter {file} refers to each file in the list C:CameraGPSexample*.LOG.We can add an execution step to instruct StyleVision Server to perform the transformation:

FlowForce Server transformation job step

The data mapping creates output files by adding .gpx to the name of the input file, and now we can define the transformation input using the {file} variable with the new file suffix. We chose to create .html output, but we could just as easily create other formats for a multi-channel publishing implementation.The transformation working directory is the location where StyleVision Server unpacks the contents of the .pxf file containing the stylesheet, XML Schema, and other needed components. Using a dedicated working folder will keep the workflow more organized.We want to allow network users to drop new .LOG files into the C:CameraGPSexample folder and we want run the FlowForce Server job on a regular schedule, but we don’t want to process the same files over and over. We can define one more job step to move the processed file to a different location:

FlowForce Server file move job step

The complete FlowForce Server job is a series of three steps that loops for each .LOG file found in the folder. We can set up a repeating trigger for the workweek or any other appropriate schedule:

FlowForce Server calendar-based job trigger

Here is a portion of a .LOG file created by the camera that is an example of one input file:

.csv input file example

We can drop this file into the C:CameraGPSexample folder, where it will be processed based on the FlowForce Server job trigger:

Workflow folder structure

When the timer triggers execution of the FlowForce Server job, the Web interface Job Log page displays this series of messages for the complete job:

FlowForce Server job log for complete job execution

The contents of the C:CameraGPSexample folder now look like this:

Completed work files after FlowForce Server job execution

We can examine the 121130.LOG.gpx file in XMLSpy:

XML file created by MapForce Server job step

And we can open the .html file in any Web browser:

.html output from StyleVision Server job step

In future blog posts we will enhance this FlowForce Server example to illustrate jobs with error handling and more complete cleanup of working files.FlowForce Server is available for Windows, Linux, and soon for Mac OS platforms. To get started yourself, click here to download a free trial!

Tags: , , , , ,

Analyze Football Statistics using the Altova MissionKit


In this article we use stats from NFL.com and ESPN.com to show how easy it can be to process and analyze online data in new ways – even when it uses different metrics and is only available in textual format. We have seen in previous blog posts how easy it is to gather data from the Internet that is widely available in XML formats. But what about interesting data that is available online but not in an XML format, or data that is buried in legacy data processing systems and only available in textual report format? One such example involves quarterback ratings. The NFL has used a Passer Rating that rates quarterbacks solely based on a passer’s completions, attempts, touchdowns, and interceptions. ESPN introduced a new rating system this year called the Total QBR (Quarterback Rating). The Total QBR incorporates more data, including an expected points average and a clutch play index, that ESPN claims gives a more accurate measure of a quarterback’s performance. Let’s compare the rankings that these system produce to see if we can garner some useful information. For this example we’ll be using the data importing and analysis tools of the Altova MissionKit to compare the ratings. If you want to try this out yourself, the MissionKit is available to download for a 30 day free trial from the Altova web site. You can access the files used in this example here. The first thing we need is the raw data to analyze. Let’s use the entire 2010 season as a data source. We can get the table with Passer Ratings from NFL.com and then copy and paste it as a new text file. NFL.com_top5_passers_2010 We can access a similar table of Total Quarterback Ratings from the ESPN web site and create a second text file. ESPN_Total_QBR_Top5_2010 We now have two text files with tables of data in different orders. The next step is to combine the tables into one file and generate charts. First, we need a schema file for the destination of the data. In XMLSpy, we can create an XSD file quickly, and graphically, to contain a series of QB nodes with child nodes of first and last name, team, passer rating and rank, and total QBR and rank. QB_Schema.xsd Now, in MapForce, we open the text documents and use FlexText to parse the text and change it into a list of categories. NFL_QB_Data_FlexText Total_QBR We then build a mapping file in MapForce to map the data from the text files to the destination XML file. Built-in functions make it easy to extract the first and last names from the Player string, and a value-map will change the team abbreviation to a string (ARI is changed to Arizona Cardinals, ATL to Atlanta Falcons, etc.). We set the Priority Context in the test of our filters to make sure we get the correct set of data for each unique quarterback. QB_Schema Once we execute the mapping, we can save the resulting XML data file and use it as the source file in StyleVision to design a stylesheet. In this stylesheet, we create a table of the top ten ranked passers and charts showing the Passer Rating and the Total QBR graphically. QB_Charts1 QB_Charts2 Now that we have a visual representation of the rankings of the two rating systems, we can examine their differences and try to see which works better. For example, Peyton Manning was tenth in passer rating, but was second in Total QBR. This can be explained by the Total QBR taking clutch points into account and knowing that Peyton Manning had a few late game comebacks in the 2010 season. Since we now have a collection of files (the XSD file built in XMLSpy, the FlexText and mapping files from MapForce, and the stylesheet design created in StyleVision), we can update the text data files easily to analyze new sets of quarterback data. Later in the season, we can update the text tables with 2011 data, and allow the data to flow through the mappings and into the stylesheet to update the charts and see the rankings for the current season. This example focuses on numbers from the NFL, but this method can easily be adapted to other data sets and data sources that are accessed as text files as well as in other formats. You can learn more about how to use the products in the Altova MissionKit by taking our free online training courses.

Tags: , , , ,

Hot off the Press!


The industry is abuzz with the latest news announcing our release of the MissionKit Version 2011 Release 2. The release is loaded with new features for chart and report creation, enhanced data mapping capabilities, new XML Schema editing functionality, support for the latest version of BPMN, and a really cool new feature for comparing and merging Microsoft® Word documents. clip_image002 Dr Dobb’s and SQL Server magazine are just a few of the industry publications and blogs that covered the launch. clip_image004   clip_image003 Read what the industry is buzzing about and then download a free 30-day trial of the MissionKit and check out for yourself all the powerful new features now available in our suite of XML, database, and UML tools!

Tags: , , , , , , , , , , , , , , , , ,

Advanced Presentation and Formatting in StyleVision


The StyleVision stylesheet and report design tool has added a plethora of advanced functionality over the past several releases. In this post we’ll explore some of the advanced presentation and formatting capabilities that make this tool so powerful. Data visualization (e.g., charts and graphs) and other graphical elements are de rigueur these days. Whether it’s showing change over time via a simple bar graph, highlighting performance with an image from the art department, presenting market data with a candlestick chart or developing a gauge for dashboard reporting, organizations today demand the ability to include sophisticated graphics on all sorts of output – including Web sites. Altova StyleVision 2011r2 can help you meet these demands with advanced presentation and formatting capabilities. You can use StyleVision to generate graphical representations of XML, database, and XBRL data for output to eForms, PDF, HTML, RTF, and Word 2007+. Advanced formatting capabilities will enable you to create impressive charts, graphs and other data views that resonate with audiences. In addition to 2D and 3D bar and pie charts, you can create line, area, candlestick, and gauge charts for use on Web sites or printed materials. Overlay reports provide you with the ability to juxtapose two data sets such as opening, high, low, and closing share prices (candlestick chart) with daily share volume (bar chart) as pictured here. Create Overlay Reports with StyleVision Comprehensive style attributes including colors, background images, legends, and even dynamic XPath settings provide you with complete control over how XML, database, and XBRL data are presented. Among pie chart attributes StyleVision users can select from, for example, are start angle, drop shadow, tilt (for 3D), color scheme (including user defined), and visibility of values, percentages, labels and legends. Create Advanced Pie Charts with StyleVision Adding background color and images is easy with drop down boxes – to achieve the yellow vertical gradient pictured in the overlay chart below simply go to All Settings under Appearance in the Chart Configuration dialog box, select Background Color in the Plot section of the General tab and select vertical gradient and the yellow color swatch from the drop down boxes.Advanced Charting with StyleVision StyleVision even offers users the ability to design templates so that output can be modified dynamically based on end user input. Below is an eForm that presents information in English and German depending on which button is toggled – conditional statements associated with a variable declared at the $XML template control this. Please note that the formatting in the Date field changes as well. Design Forms in Multiple Languages with StyleVision Design Forms in Multiple Languages with StyleVision Keep in mind that any form that you would like to reproduce in StyleVision can be imported as a “blueprint,” a configurable image that serves as a template. This allows the designer to place text, input fields, and other design elements directly on the template and makes it easy to build an eForm identical to the original. With advanced presentation and formatting for charts and graphs Altova significantly extends the capabilities of StyleVision’s already powerful report builder – your designs are limited only by your imagination. clip_image008 We’d love to hear how you are using these or other capabilities in developing your own projects. Please share your stories by posting to our Facebook wall or commenting here on our blog! If you haven’t tried StyleVision before, now is the time. Download a free, fully functional, 30-day trial from the Altova Web site now.

Tags: , , ,

Introducing XMLSpy 2011 Chinese Language Edition


We are thrilled to announce that with the release of Version 2011, XMLSpy is now available in a Chinese language edition. The new fully localized Chinese edition of the XMLSpy XML editor provides the same powerful functionality found in the English, German, and Japanese versions for editing, transforming, and debugging XML-related technologies. With the release of Version 2011 XMLSpy also adds ground-breaking new support for creating eye-catching charts based on XML data, making it the first and only XML editor on the market to support chart creation. XMLSpy 2011 also delivers several new customer-requested features, including a new schema flattener, extended SOAP validation capabilities, and enhanced functionality for creating schemas. ChineseScreenshot For our current XMLSpy 2011 customers you can unlock any language version using your existing key code. If you’re not an XMLSpy user download a free trial of XMLSpy 2011 to begin using all of the powerful new functionality available in Version 2011. Our decision to bring the localizations services in-house demonstrates our commitment to the Chinese market, and allows us to pass that cost savings on to you, our customers. The Chinese language version of Altova XMLSpy 2011 is currently available in Professional and Enterprise Editions and is available for purchase now from the Altova Online Shop or through your preferred reseller. XMLSpy 2011中文版本推出 我们很激动地宣布2011版本的发布,XMLSpy现在已有中文版可用,新的完全本地化的中文版XMLSpy XML编辑器如今可以提供英语,德语和日语多语种的编辑,转换和调试XML相关的技术,随着2011年的版本,我们还增加了突破性的基于XML数据创建醒目图表的支持,使之成为商场上第一个和唯一一个支持图表创建的XML编辑器,除此以外,我们还添加了多个客户要求的功能,这些功能包括新模式拼合,扩展的SOAP验证和为创建模式增进的功能。 ChineseScreenshot XMLSpy 2011当前的用户可以使用现有的键码解锁全部语言的版本,如果您还不是我们的用户,您可以下载免费试用版本,开始尝试2011版的强大新功能。 我们的本地化决定证明了我们致力于对中国市场的决心,使我们有机会帮助用户来节约成本,价格从136欧元或15232人民币起,标准,专业和企业版都具备中文版本,您可以通过Altova网店或其他首选经销商购买。

Tags: , , , , , ,

New Software Release : StyleVision 2011


On September 8, Altova released v2011 of the MissionKit with the addition of powerful reporting functionality across many of the products. Specifically, StyleVision has been supercharged with a multitude of new features, securing its place as an advanced and versatile business intelligence application, priced for today’s market. Let’s take a closer look at the exciting new features in StyleVision 2011 including:

  • Charts as a new design element
  • Chart wizard for XBRL files
  • Explicit support for HTML/CALS tables
  • Ability to import existing XSLT files
  • Scripting & toolbar editor for Authentic®

Charts as a new design element StyleVision joins other MissionKit 2011 tools with support for charting, adding to its already advanced general purpose reporting capabilities to create a highly scalable decision support tool for XML, database, and XBRL content. As with all StyleVision designs, charts can be easily rendered for multi-channel output in HTML, RTF, PDF, Word 2007+, and electronic forms. The following types of charts are available:

  • 2D & 3D pie charts
  • 2D & 3D bar charts
  • Category line graphs
  • Value line graphs
  • Gauge charts

The chart configuration dialog lets you use XPath to select data for your charts. This can be as simple or as complex as you want, running the gamut from database data that is already laid out in a tabular format to XML files where the nodes you need to select are spread out over hundreds of lines of code. Pssst… if you’re thinking that this would be great for the unique demands of XBRL, read on because we created something special with that in mind ;). Here are a couple of examples of charts that you can build in StyleVision: clip_image001 clip_image003 Yup, you can even chart completely different sets of data on the same graph. How creative you want to get with your visual analysis reports is really up to you. You can even create interactive charts for use with Authentic – allowing end users to manipulate eForms to view the desired result. For example, the screenshot below shows the Authentic view of a pie chart where a drop-down menu (combo box) selection dictates the subset of data that is represented. clip_image005 Charts are easily integrated into your StyleVision report templates at any point by simply dragging the relevant node onto the design pane and choosing Insert Chart from the context menu. The Chart Configuration dialog can then be used for chart settings (choosing chart type and style) and data selection (populating your chart axes with the relevant data from the source). clip_image007 You can even use Dynamic XPath Settings to apply transactional data to your chart. Of course, if you sometimes have trouble telling your .s from your /s, you can always get some help with more complex expressions from StyleVision’s XPath Builder. Chart wizard for XBRL files If you are familiar with XBRL, you are intimately aware of the complexities associated with navigating XBRL taxonomies. And, if you’re impressed with what you’ve just read about StyleVision’s charting capabilities, you are probably trying to remember where you put that old XPath reference guide. Not to worry! StyleVision has added to its XBRL rendering support with an XBRL Chart Wizard that lets you easily select data and define presentation settings for your XBRL reports. clip_image009 Concept and Period Properties dialogs are included to let you specify which elements should be included and how periods (instants or intervals of time) should be handled in your chart. Explicit support for HTML/CALS tables StyleVision now provides direct support for HTML/CALS tables, meaning that it will automatically recognize values dictating table structure (column number, row height, etc.) and apply them to rendered output. (v2011 adds support for rendering HTML/CALS tables in HTML, RTF, PDF, AND Word 2007+ – previous releases have supported output to Authentic eForms.) clip_image011 You can also easily assign additional presentation styles to HTML/CALS tables using the Edit CALS/HTML dialog. clip_image013 Ability to import existing XSLT files Well, I’m sure a few of you were hoping that this one was coming soon… You can now base your StyleVision template designs on existing XSLT files that were designed for HTML output or XSLT files with XSL:FO commands that were designed for output to PDF. Simply choose the New from XSLT File option and presto change-o, your design will be fully manifested in the design pane. Now you can edit your template using StyleVision’s graphical interface and output to even more formats (HTML, RTF, PDF, Word 2007+, and Authentic eForms) with just the click of a button. Scripting & toolbar editor for Authentic This feature is just way too cool not to devote an entire post to it, so keep your eyes peeled for a full description coming up on this blog. In the meantime, check out the Authentic scripting page for a brief description and examples. Better yet, just download a free 30-day trial of StyleVision today to test drive all of these new features for yourself!

Tags: , , , , , , ,

XMLSpy Version 2011


XMLSpy XML editor We recently blogged about the release of the Version 2011 MissionKit and all the new features it included. Let’s take a closer look now at XMLSpy 2011 and what’s new in the XML editor:

  • Creation of pie, line, bar, and gauge charts from XML
  • Validation of SOAP messages against the SOAP spec & corresponding WSDL file
  • Schema flattener
  • Schema subset picker

Creation of charts & graphs from XML data

Like several other tools in the MissionKit 2011, XMLSpy now supports chart and graph generation. Chart creation is unique to XMLSpy and brings a whole new dimension to working with data in an XML editor. Now you can visualize and analyze numerical XML data – and XBRL data – directly inside XMLSpy with just a few clicks. No more exporting to Excel! The following types of charts are available:

  • 2D & 3D pie charts
  • 2D & 3D bar charts
  • Category line graphs
  • Value line graphs
  • Gauge charts

Below are two example charts that show just some of the possibilities for representing XML data in attractive, meaningful way – with just a few clicks: Pie chart showing XML data Bar graph showing XML data To create a new chart, simply highlight a range of data in Text View or Grid View, right click, and select New Chart. You can also specify the data to chart via XPath expression. Once you’ve used the Select Columns dialog to specify which data you want displayed, either via XPath or by highlighting it in the window, and how you want to display it…. Select columns for XML chart …you can choose the type if chart you require, and the appearance of the chart, from colors to fonts and more. You can create up to nine different charts on the available tabs in the Output Window, and you can save each as a custom-sized image file with just a click or print it directly from XMLSpy. You can also copy it to your clipboard to paste it in another application, such as Microsoft® Word or PowerPoint. One of the coolest aspects of these charts is that they’re totally dynamic. Once you make a change to the underlying XML data, the chart can be instantly regenerated, either automatically by hitting Reload, depending on your preference. What’s more, you can copy the XSLT or XQuery code to create the chart to the clipboard for use in your own stylesheet or application. The XSLT/XQuery code can be executed in XMLSpy and via AltovaXML 2011 Enterprise Edition, Altova’s XML standards processor. Chart support extends to the XMLSpy XSLT profiler and XQuery profiler, as well. After profiling an XSLT or XQuery execution, one click creates a chart to help you immediately visualize the results based on one or more criteria. This makes it easy to immediately interpret the results of a profiling an XSLT or XQuery execution or to communicate those results with other team members in a powerful, visual way.

Validation of SOAP messages

Requested often by our customers, this new feature will be very useful for Web services developers, as it allows them to ensure their SOAP messages are valid against the SOAP specification as well as any XML Schemas referenced in the corresponding WSDL definition.

Schema flattener

The new schema flattener in XMLSpy 2011 allows schema designers to write all the dependent files that are included in a schema into one file. This way, you can use the flattened XML Schema without having to rely on a network connection to access the required files. This could be especially important when shipping a schema within an application. Schema Flattener

Schema subset picker

Many schemas are quite large and contain more types and elements than are required for a particular application or information exchange. Furthermore, the larger a schema is, the longer loading and validation may take. The ability to create a new schema from a subset means a developer can select some global elements or types from a large schema to create a smaller one, using just the elements required. This feature is especially useful for working with NIEM information exchanges, but has also been requested by other users for a variety of applications. Creating a schema from a subset   Read about all the features added to the Altova MissionKit tool suite or download the latest version now. If you’re a current customer with an active Support & Maintenance Package, you can update to v2011 for free.

Tags: , , , , ,

Altova MissionKit 2011 is Now Available!


MissionKit Version 2011 Reporting Tools The Altova team is excited to announce the release of Version 2011 of our MissionKit tool suite and entire product line. This release delivers a multitude of innovative features, including robust chart and reporting functionality for analyzing and communicating XML, database, XBRL, EDI – virtually any type of data – in a meaningful, eye-catching way. Charts are created with a few clicks inside MissionKit tools and can be immediately shared via copy/paste or saved as image files – that’s right, no more exporting to Excel – or integrated in reports or data entry applications designed in Altova StyleVision. Of course, you can also get the XSLT or XQuery code for generating the chart for use in your own apps. The MissionKit 2011 includes a wide range of other new features– like SOAP validation, schema flattening and subset creation, database UML diagrams, and more – and we’ll cover all of those subsequent blog posts. For now let’s focus on the new charting and reporting features across the Version 2011 MissionKit.

CHARTS

Charts can now be generated and used in the MissionKit 2011 XML and database tools in a variety of ways. The following types of charts and graphs are available for providing a graphical representation of numerical data:

  • 2D & 3D pie charts
  • 2D & 3D bar charts
  • Category line graphs
  • Value line graphs
  • Gauge charts

Charts are fully dynamic and can be automatically or manually regenerated when backend data is updated. XMLSpy You can create a new chart directly in the XML editor by simply highlighting a range of data in either Text View or Grid View and selecting New Chart from the right-click context menu. Bar chart from XML data 
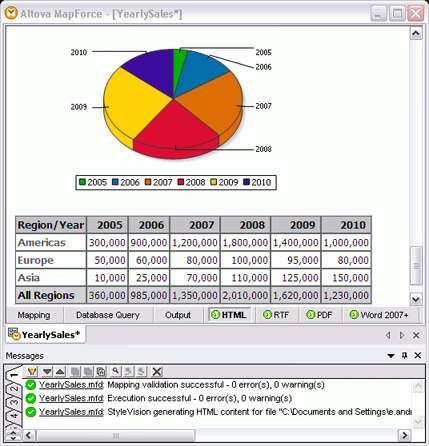
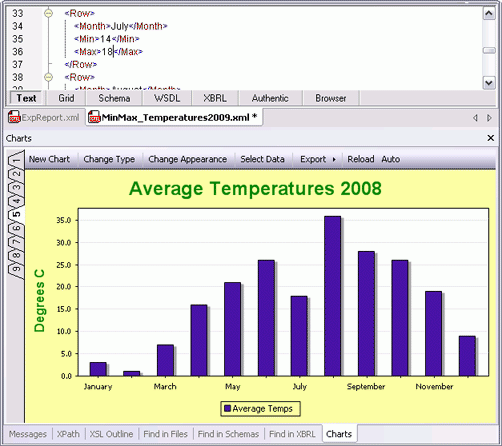
The chart’s appearance, labels, and so on, are highly customizable, and your finished chart can be printed, copied to the clipboard, saved as an image, or – and this is truly unique – exported as XSLT or XQuery code for use in your own stylesheets, reports, or apps. Line graph from XML 
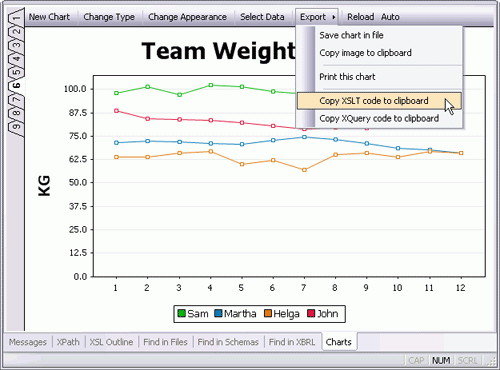
XMLSpy is the first and only XML editor on the market to support this powerful functionality, giving our users a distinct advantage when it comes to analyzing and interpreting XML data. You can also create a chart to visualize the results delivered by the XMLSpy XSLT Profiler and XQuery Profiler, making it easy to interpret and communicate performance data. StyleVision Charting and graphing support in StyleVision 2011, the stylesheet and report design tool, allows you to present data in a powerful, visual way, so that it can be easily analyzed from a variety of different angles. When you’re creating an XML, database, or XBRL report (or even a data entry form for use in Altova Authentic), it’s easy to specify your chart parameters via XPath and then customize the appearance of your chart or graph. Report builder with chart 
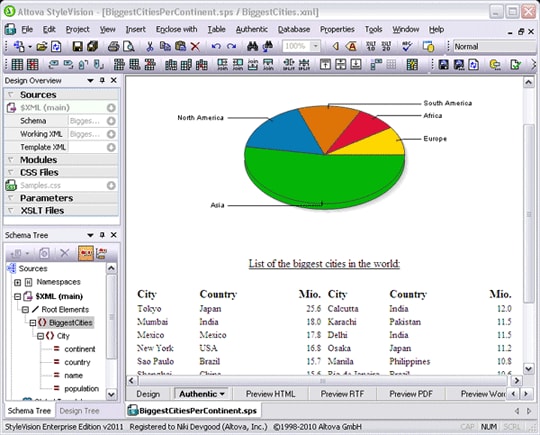
You can even utilize dynamic XPath settings to apply dynamic data from your source to the settings of your chart. For example, if you have a chart that shows regional data, you may wish to reflect the name of each region in the title of your chart. If there are several Region elements, the data for the chart title can be selected dynamically via an XPath expression depending on which set of data is being presented in the chart. Charts are integrated in multi-channel StyleVision reports, described further below. DatabaseSpy Relational database data often lends itself perfectly to a graphical representation, but it’s not always easy to create charts to analyze relationships locked away in database tables. Now, with DatabaseSpy 2011, it’s as simple as selecting the column(s) you wish to chart. Chart of database data 
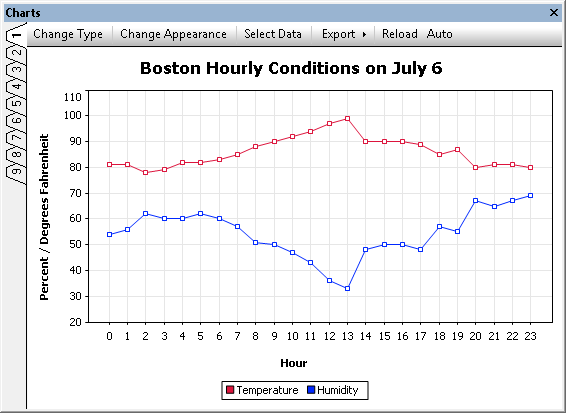
You can even generate and save charts based on calculations performed in a SQL query – such as averages, percentages, etc. As with XMLSpy, charts may be saved as image files, printed, and copied to your clipboard. DatabaseSpy supports all major relational databases, and even with this charting functionality and its other advanced tools, it’s ridiculously affordable.

REPORTS

StyleVision The new chart creation functionality described above adds a whole new level of sophistication to Altova’s general purpose reporting tool, StyleVision. While you’ve been able to design attractive XML, database, and XBRL reports in previous versions of StyleVision, now you can also include dynamic charts for full featured, multi-channel reporting in digital formats like HTML and e-Forms, and print media including Word and PDF. Advanced options such as drag-and-drop design, absolute positioning, modular designs, conditional templates, support for importing and/or reusing existing XSLT stylesheets, dynamic data selection, and more, combine to make StyleVision robust solution for business reporting on any scale. Report builder / report tool 
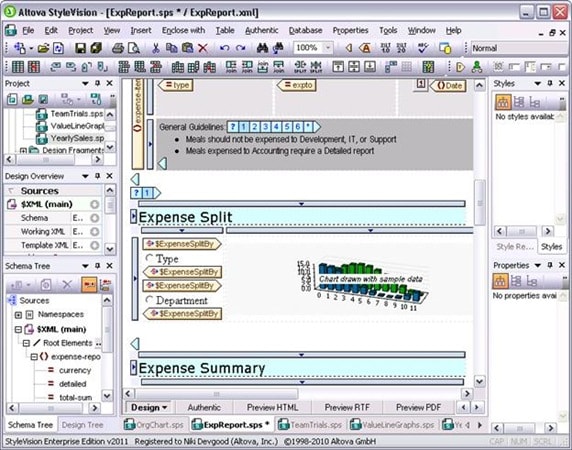
In fact, StyleVision now integrates with MapForce – so you can design reports for virtually any type of data. MapForce Starting with Version 2011, MapForce supports integration with StyleVision, allowing MapForce users to automatically render results of their XML and XBRL mappings using an associated StyleVision report design. This very powerful feature essentially combines MapForce’s any-to-any data mapping capabilities with a sophisticated rendering engine, meaning that you can now automate chart and report generation from virtually any data format – including databases, flat files, Excel, EDI, and more – that can be mapped to an XML Schema or XBRL taxonomy. Chart of mapped data

DOWNLOAD VERSION 2011

Whether you need to generate charts while working with XML or databases, or you need to design full-featured reports with dynamic, multi-channel output, we hope you’ll check out the new MissionKit 2011. Then, post a comment here on the blog to let us know what you think! Upgrade or Download a Free Trial See more details and screenshots, or download Version 2011 now. Current customers with active support and maintenance can download the new version for free. A fully functional 30-day trial is also available.

STAY TUNED…

More details about all the new features added in Version 2011 will be posted in the coming days.

Tags: , , , ,