Mastering Paid Keywords
Anyone who manages paid keyword search knows it is hard work! You can look at vast reports of raw statistics and quickly get lost in trivia. At Altova we designed a better way to analyze and manage the performance data for our Google Adwords campaigns. We can creatively query the numbers to: · Quickly aggregate results for subcategories of campaigns, for instance by product, geographical region, or any other grouping · Easily identify trends over time The chart below illustrates these advantages by collecting data for a single Altova product – SemanticWorks – from multiple campaigns over six individual months.  Starting Out Like many keyword advertisers, we were viewing statistics in Adwords, downloading CSV files, then spending hours massaging and manipulating the data in spreadsheets to identify and format the information we required. We wanted more immediate and in-depth reporting of keyword performance while retaining full control of the process and managing everything internally. SQL queries of a database of keyword statistics offer a powerful and flexible alternative. In the remainder of this post we explain how the database design, data mapping, and reporting features of the Altova MissionKit can be applied to create an architecture to efficiently track paid keyword performance. Database Design Our choices were to implement a keywords database on an existing database platform already running in the company, an express edition of a commercial database, or an open-source database, since the Altova MissionKit works with SQL Server®, MySQL®, Oracle®, IBM DB2®, PostgreSQL®, Sybase®, and Microsoft® Access®. We chose SQL Server for our database platform. We connected with DatabaseSpy and used the graphical database Design Editor to create the table shown below.
  Most columns correspond to fields in a keywords report. In order to store multiple rows for each individual keyword – one row for every month of statistics – the table also includes columns for the month and year. Populating the Table The Google Adwords online interface lets users create reports of keyword statistics of specific date ranges and download them as CSV files. We downloaded individual CSV files containing our performance data for each unique month. We used MapForce to map values from the CSV files to columns in the database table and insert the month and year data for each row.
  The string functions at the bottom center of the mapping diagram remove percent signs and commas from fields we want to treat as numerical data. By doing this in the mapping, we don’t have to massage the columns of data in the CSV files before importing them. Since the CSV files for each month all have the same structure, the mapping needs only minor revisions to import each new month’s data: update the constants at the top that define the starting row id, month, and year. MapForce processes the mapping with its built-in execution engine, reading the CSV input and generating SQL INSERT statements for each row of data. MapForce then allows users to execute the entire generated SQL script by clicking a toolbar icon or from a selection in the Output menu:
  Querying the Database Back in DatabaseSpy, we can query the database from the SQL Editor window. This query reports the top ten performing keywords for SemanticWorks in October 2011. For data privacy, some fields in the Results chart are hidden.
  To get additional interesting results, the SQL statement can be easily modified. For instance, the ORDER BY line can sort for highest cost, most clicks, or any other characteristic. The WHERE statement combines data from multiple campaigns. The LIKE keyword treats the percent signs around SemanticWorks as wildcard characters to match any campaign with SemanticWorks anywhere in its name. Other queries could add a geographic identifier such as US or EU, or match on an entirely different column such as adgroup. Of course, all these options depend on a consistent and predictable campaign and adgroup naming system. We created a DatabaseSpy Project to collect all our favorite SQL queries for sharing and convenient reuse. Here is the query we used to generate the chart right in DatabaseSpy that appears at the top of this post:
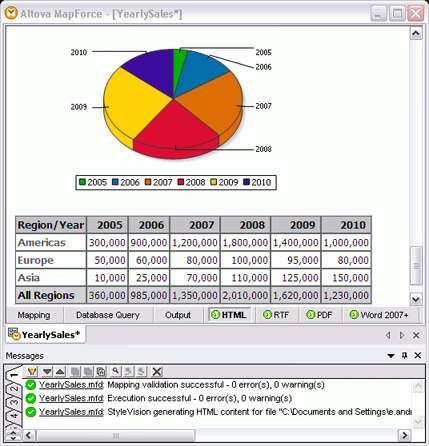
  This query goes beyond simple SQL reporting to perform calculations on a subset of the data and format the results. Database Reports We designed reports for the executive team using Altova StyleVision, based on the queries and charts we had already designed in DatabaseSpy. We simply copied our queries from the DatabaseSpy SQL Editor window and added them as sources in the StyleVision Design Overview window. Saving our report design in a StyleVision SPS stylesheet makes it is easy to regenerate an updated version every month. Here is the HTML output for a SemanticWorks Keyword Trends report based on the query above, displayed in the StyleVision Preview window:
  If you follow the conventional wisdom for building your own paid keyword campaigns, you will develop segmented campaigns with many small, highly specialized ad groups, and you may also find yourself overwhelmed by the data in Adwords reports. If you’d like to try managing your own keywords the way we describe here, a fully functional trial of the Altova MissionKit is available.


 The Altova team is excited to announce the release of
 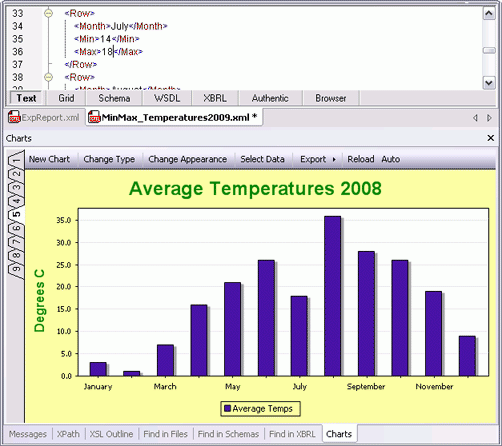 The chart’s appearance, labels, and so on, are highly customizable, and your finished chart can be printed, copied to the clipboard, saved as an image, or – and this is truly unique – exported as XSLT or XQuery code for use in your own stylesheets, reports, or apps.
 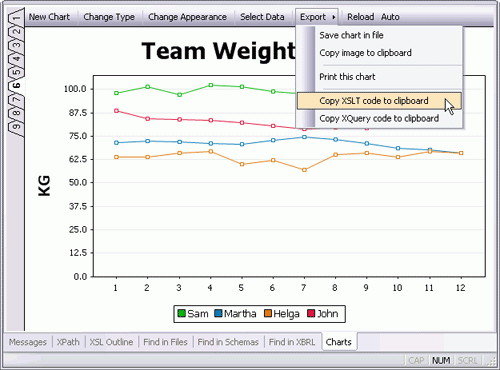 XMLSpy is the first and only
  You can even utilize dynamic XPath settings to apply dynamic data from your source to the settings of your chart. For example, if you have a chart that shows regional data, you may wish to reflect the name of each region in the title of your chart. If there are several Region elements, the data for the chart title can be selected dynamically via an XPath expression depending on which set of data is being presented in the chart. Charts are integrated in multi-channel StyleVision reports, described further below. DatabaseSpy Relational database data often lends itself perfectly to a graphical representation, but it’s not always easy to create charts to analyze relationships locked away in database tables. Now, with
 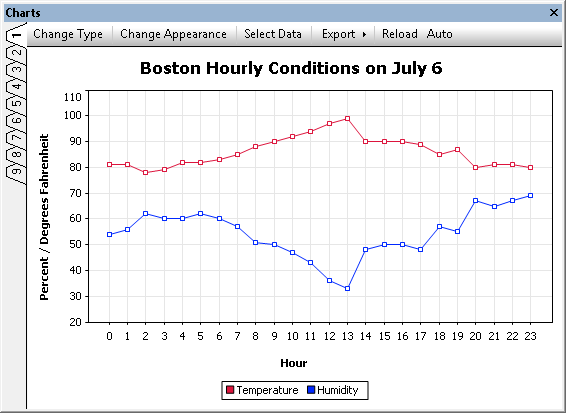 You can even generate and save
 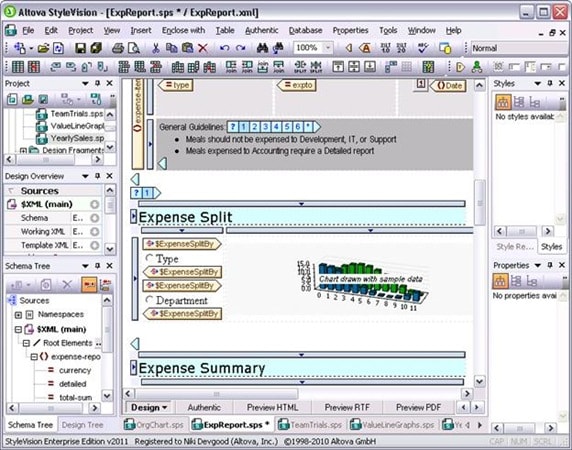 In fact, StyleVision now integrates with MapForce – so you can design reports for virtually any type of data. MapForce Starting with Version 2011,