Tag Archive for: data integration

How to Create Batch Data Mapping Projects


A common requirement in data processing is batch data mapping, especially in the context of data transformation and integration. It involves converting data in batches rather than processing individual data points one at a time. Batch data mapping is often required in data integration scenarios where input from multiple sources needs to be aligned or transformed together. Two common scenarios are “batch to batch” and “batch to one.”

In our latest series of MapForce demo videos, we explore these common data mapping challenges.

Decorative image: yellow piping in a factory setting

BATCH TO BATCH DATA MAPPING

Batch to batch data mapping is helpful in scenarios where you have data updates or changes coming in batches, and you need to synchronize or transform these batches together. This could be to convert them to a different format, perform some type of sort or calculation, or a combination of these.

In this demo, we create a data mapping project that reads files from a directory and uses wildcards to set up a mapping that will process data from multiple files at once. Then, we explore another option for defining batch conversion using dynamic file names supplied by the mapping. This demo also shows how to add calculations and comments to your data mapping projects.

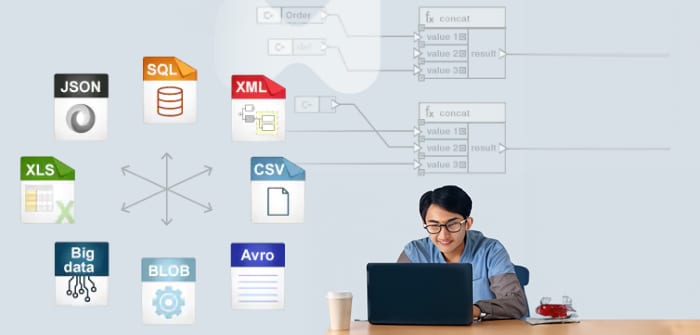
While this video highlights a batch to batch transformation of JSON files to XML files, MapForce supports conversion and transformation for any combination of XML, JSON, PDF, database, text, Protobuf, Excel, XBRL, and so on, for advanced data integration and ETL processes.

BATCH TO ONE DATA TRANSFORMATION

Batch to one data transformation is another common requirement, for example, when you want to merge or combine multiple files into a single consolidated document and perform some data transformation, conversion, or calculation operations in between.

This example also explores multiple approaches to defining the batch process, which will be applicable in different scenarios:

  1. Specifying a collection of files in the same directory using a wildcard
  2. Selecting batch files based on a list of file names stored in a different directory

This demo also shows how to sort the data merged from multiple files before writing it to the target.

After watching these quick demos, you can download a free trial of MapForce to try batch mapping, conversion, and transformation for yourself.

MORE MAPFORCE DEMOS

If you liked these videos, check out the rest of the MapForce demo series, which covers everything from mapping XML and JSON to databases to configuring data processing functions and extracting data from PDF documents.

Tags: , , , , ,

Extract Data for PDF Mapping


MapForce, Altova’s award-winning data mapping tool, now supports PDF input in data integration and ETL workflows. The powerful MapForce PDF Extractor makes it easy to define rules for extracting PDF data in a structured format to make it available for mapping to other popular formats like Excel, XML, JSON, databases, and more.

Let’s take a look at how it works.

Read more…
Tags: , , , ,

How to Convert Data in MapForce [Video]


Altova MapForce offers a powerful, yet easy-to-use, approach to converting and transforming data. Whether you need to write XML to a database, convert JSON to EDI, or map Excel to multiple different data formats, MapForce has you covered.

From simple one-to-one conversions to complex ETL scenarios, the MapForce approach is to represent data structures as graphical components. To associate fields, drag and drop connecting lines. A comprehensive library of data filters and functions is available for transforming data before writing it to the target.

Decorative image showing a person working on a laptop with data formats supported by Altova MapForce in the background

We have recently revamped our series of Introduction to MapForce videos. Each short how-to gives a demo of a common MapForce scenario.  

Start at the beginning to learn how MapForce works:

And follow along to learn:

You can follow along with the examples in these how-to videos by downloading a free, 30-day trial of MapForce. Check back for new MapForce videos, which are added often.

Tags: , , , , , , ,

Validating and Debugging Data Transformations


Software developers and other data professionals often need to transform data from one format to another. These transformations can be simple one-to-one conversions or may require more complex manipulation. For instance, relationships must be generated when importing flat CSV files into a database, or source data may need to be split for the target, as in full name vs. first, middle, last, and optional suffix. Validating data transformation is critical to prevent data loss or corruption.

In an earlier post on Web service data integration, we combined a string value for GMT time with a numeric offset in seconds to generate the local time for weather forecasts. We created a user function that performed all the steps required to complete this operation. MapForce includes a powerful interactive data mapping debugger that can easily trace and validate this transformation. Let’s take a look at how it works.

A software developer working on a computer
Read more…
Tags: , , , ,

Transforming and Converting Protobuf


MapForce supports mapping protocol buffers (Protobuf) to and from other structured data formats as mapping sources or targets. In the constant quest for more efficient ways to transfer, manipulate, and manage large structured data sets, Google has created a language- and platform-neutral data format similar to XML, but smaller, faster, and simpler than even JSON data. Tools are available to generate and work with Protobuf using Java, Python, C++, C#, Ruby, and other programming languages.

The structure of any Protobuf message is defined in a .proto file that defines each field name and value type. Altova MapForce lets users drop these .proto files into a data mapping as a source or target along with any other data, including XML, JSON, relational databases, Excel, flat files, REST and SOAP web services, and others.  .proto files versions 2 and 3 are supported.

A MapForce data mapping creates compatibility between existing XML, JSON, database or legacy data formats and new applications leveraging the efficiency of Protobuf.

Read more…

Tags: , , , ,

Excel Data Mapping to Update Existing Documents


Excel began life as a simple spreadsheet tool. Over time, support for rich text styling options, built-in charts, and copy and paste formatting features has led many enterprises to create reports in Excel documents. This can cause difficulty when data changes and existing documents need to be manually updated for distribution to a wide audience in the familiar report style.

Altova MapForce, the award-winning, graphical data mapping tool for any-to-any conversion and integration, supports Excel data mapping to convert data to existing Excel documents while preserving styles and formulas in the original.

This feature lets you write directly to nicely formatted Excel files to update data at runtime: any designated worksheets, rows, and cells from the specified file will be replaced with data from the mapping and all formatting in the existing file will be preserved as-is. To protect functionality in the existing spreadsheet, cells with formulas are not overwritten.

Let’s look at an example of how to map Excel data.

Financial pros using XBRL
Read more…
Tags: , , ,

API Data Mapping


Web service data integration with MapForce is a popular and proven strategy to capture timely information for analysis or generation of user-friendly reports. In an earlier post we demonstrated API data mapping in 5-day weather forecasts for busy cargo shipping ports by reading Web service data in JSON format and mapping to richly formatted Excel spreadsheets. The weather API we used  is hosted by OpenWeather, a provider of historical, current, and weather forecast data.

But integrating data from any API is not a set-it-and-forget-it task. When you build a solution based on external data, you have to react quickly when the data structure changes. Since our original integration project OpenWeather revised the data delivered by their API. The API now includes wind gust predictions in a JSON property separate from wind speed. Since wind gusts are suspected as a cause of the recent Suez Canal blockage the new data is very relevant to our application! Fortunately, both the MapForce data mapping and the Excel spreadsheet are easily revised to add new data.

Read more…
Tags: , , , ,

How to View Workflow Automation Reports on FlowForce Server


Altova FlowForce Server is a high-performance workflow engine for automating enterprise-level data processing, data integration, and ETL jobs.

FlowForce Server includes a helpful web interface for managing and monitoring all aspects of data processing jobs, including in-depth logging functionality and a complete visual dashboard. Let’s take a look at how you can take advantage of FlowForce charts and statistics to monitor the progress of FlowForce Server jobs, as well as performance of the server itself, in great detail.

Article about FlowForce Server
Read more…
Tags: , , , ,

New XML Grid and More in v2021r2


In the latest release of Altova desktop developer tools and server software products, we’re introducing a completely rebuilt XML Grid View, support for XSLT3 for XML data mapping, statistics and charts for monitoring FlowForce Server, and much more. Let’s take a look at the highlights of Altova Software Version 2021 Release 2. 

New features in Altova v2021r2
Read more…
Tags: , , , , , ,

Web Service Data Integration


In a previous post we wrote that every data integration and reporting task needs to start with a clear understanding of the source data. Using grid view in XMLSpy, the industry-leading XML and JSON editor, we analyzed JSON data for 5-day weather forecasts retrieved from a Web service.

Continuing with our earlier scenario, we’ll use MapForce, the award-winning, graphical data mapping tool for any-to-any conversion and integration, to map the forecasts for a series of major cargo shipping ports into nicely formatted Excel documents. We’ll want to highlight any predicted high winds or heavy rainfall that could cause delays by interfering with cranes loading and unloading containers, or slowing ships entering and exiting the harbors.

Read more…
Tags: , , , , ,

New Data Integration Tools


Altova MissionKit tools offer numerous ways to connect to, query, and integrate data from disparate sources. With multiple product releases each year, we’re constantly working to deliver increased power and efficiency for data integration, while adding features requested by customers. This includes ongoing updates to built-in support for all major SQL databases across the product line.

Let’s take a look at some of the recently added tools and enhancements.

New data integration tools in Altova's release
Read more…
Tags: , , , , , , ,

Database Tracing to Log Changes Made by a Data Mapping Project


Database administrators and other data professionals often want to maintain a record of changes in critical databases, especially when updates are made by automated scripts or other operations. Database tracing lets administrators track critical changes or anomalies, and help recover from errors. Altova MapForce supports database tracing for all popular relational databases to log the changes made by a data mapping project to the database when the mapping runs.

When tracing is enabled, events such as database insert or update actions, or errors, are logged in an XML file that you can later analyze or process further in an automated way.

Database tracing can be enabled at the database component, table, stored procedure, or database field level. You can choose to trace all messages or only errors, or you can disable tracing completely.

In addition to tracing errors that occur during the execution of a mapping to a target database, MapForce also enables database transaction handling to roll back the affected part of the database data when an error occurs, then optionally proceed with the rest of the mapping.

Read more…
Tags: , , , ,

Mapping Structured Data with Enhanced Node Functions


We’ve reported previously on support for node functions that simplify mapping structured data by eliminating need to copy-paste a function multiple times into a mapping. Repeating the same function unnecessarily clutters the mapping layout and makes the data mapping more difficult to understand or revise.

Now in MapForce 2019, additional filters are available for defining node functions. These new parameters allow developers to apply functions and default values to specific nodes based on custom-defined criteria. For example, you can apply a node function based on node metadata such as the node name, node length, precision of the node’s data type, customized node annotations, and more.

Let’s look at a mapping with enhanced node functions.

Read more…

Tags: , , ,

Get Sharp with Altova’s Latest Release


Altova Software Version 2019 introduces over 20 new features to help you sharpen your development game – starting with support for high-res monitors in both XMLSpy and UModel. There are also tools for working with new standards and database versions across the product line, the ability to map and convert data in Google Protocol Buffers format, and much more. Let’s take a look at the highlights.

Altova Version 2019

Read more…

Tags: , , , , , , ,

Integrating APIs and Mobile Apps


Busy mobile users on the go prefer apps that are convenient and efficient. MobileTogether provides developers with features to seamlessly integrate APIs and mobile apps to combine mobile device functionality with up-to-date information from external sources. This empowers developers to create custom cross-platform native apps that provide a rich and entertaining end-user experience.

Public APIs are a great source of external data to enhance almost any custom mobile app. Developers can combine information from multiple APIs to provide users with better information, faster, in an elegant, integrated package.

APIs are available for almost any kind of information your mobile app may need, from flight tracking to commodity or stock prices to tropical storm tracking.

In this post we’ll look at a GPS app that starts with mobile device geolocation functionality to answer the basic question, “Where am I?” then interfaces with APIs from Google and MapQuest to add a wealth of additional information. We’ll integrate a spatially-aware search engine to locate nearby points of interest as near as a quarter mile radius, all the way to pin-pointing the user’s location in a satellite photograph with a wide-angle view of an entire continent or more.

Read more…

Tags: , ,

Data Mapping NCPDP SCRIPT


EDI (Electronic Data Interchange) standards allow participants with different roles in an industry to communicate clearly and rapidly, and date back to the earliest implementations of electronic communication in the 1950s, long before modern business technologies such as ERP, CRM, and many others. Yet even today, EDI standards continue to evolve to support new requirements and opportunities.

MapForce has long supported data mapping to and from ANSI X12, UN/EDIFACT and other popular EDI standards, and now in the latest release adds support for data mapping NCPDP SCRIPT.

SCRIPT is the state of the art EDI standard developed by the National Council for Prescription Drug Programs (NCPDP) for electronically transmitting medical prescriptions, also known as ePrescribing (eRX) in the United States.

Read more…

Tags: , , ,

Use Join to Integrate Data in Any Format


Join is a powerful SQL operation implemented across most database types and familiar to database users. Join is typically used to select and combine information from multiple database tables.

Altova MapForce includes a join component for data mapping that works like a SQL join for database tables and extends data integration functionality by empowering users to join data trees of any data format. Anyone familiar with join operations for database tables will find the MapForce join component especially intuitive. A join operation in MapForce can even combine two different data formats and produce output in a new format altogether.

Read more…

Tags: , , ,

A Typical MapForce Server Use Case


Envision a manufacturing company that controls costs by exploiting a just-in-time assembly process with a very low supply of parts inventory on hand. New customer orders are logged in a sales database and at the end of every day the components needed to assemble that day’s sales are tabulated.

The IT department runs a SQL query to identify the required parts and transforms the list into a purchase order in JSON format to be transmitted to the supply chain.

Sound familiar? Our recent blog series on JSON tools and JSON data mapping were based on this real-life scenario. In this post we describe a MapForce Server use case that automates the repetitive task of generating each day’s purchase order.

Read more…

Tags: , , ,

MapForce Offers Dynamic Access to Node Names


There are situations, especially when encountering loosely structured data, where you may want to map and transform structural components of a data stream along with content. MapForce 2017 includes a new feature to dynamically access node names of XML elements, attributes, or text file columns such as the contents of CSV files, to target components.

Dynamic access to node names allows creation on the fly of target elements and attributes whose names do not need to be known beforehand or specifically identified in the data mapping. This feature lets you create much more generic, flexible, and reusable mappings that require less manual intervention if data models evolve.

News about Dynamic Access to Node Names in MapForce 2017

Read more…

Tags: , , ,

Five Not-to-Miss Features in Altova’s Latest Product Release


I’m excited to reveal some details of today’s Release 2 of Altova MissionKit 2016 desktop developer tools and software products!

v2016r2 introduces over 20 new features and updates to the Altova product line – but that’s a lot to cover in one blog post. Let’s take a look at the top five that are sure to blow your socks off.

New in Altova products

Read more…

Tags: , , , , ,

Applying Data Mapping Patterns


Altova MapForce includes powerful mapping components that correspond to design patterns for data transformation requirements. Analyzing a data mapping challenge up front and following a few straightforward guidelines can uncover data mapping patterns that help simplify creation of the mapping design and lead to an optimal solution. The MapForce Examples project provides sample mapping files and data sets that illustrate many common data mapping patterns. Reviewing these examples and executing them with the MapForce Built-in Execution Engine is another good way to help select the best pattern for your own project.

shutterstock_240957604

Read more…

Tags: , ,

Interactive Debugger for Data Integration Projects


MapForce 2016 introduces a revolutionary data mapping debugger that lets developers working on data integration projects examine data mapping output step by step to diagnose and perfect projects of any complexity. The MapForce data mapping debugger gives users deep insight into the exact inner workings of data integration and ETL projects in a way that was never before possible.

The debugger works with all MapForce data mappings for any combination of XML, XBRL, JSON, databases, flat files, EDI, Excel, or Web services data, including chained mappings, mappings with multiple input or output components, and mappings that include user-defined functions.

Data Mapping Debugger

The MapForce data mapping debugger supports breakpoints and conditional breakpoints, and includes multiple manual stepping options to manually debug a data mapping or continue execution after a breakpoint is reached, allowing users to see as much detail as they need.
Read more…

Tags: , ,

Data Mapping Files with XML Mixed Content


As more specialized data is adapted for delivery on demand to mobile devices with smaller screens, documents with complex structures can be a challenge. Fortunately, MapForce, Altova’s graphical data mapping, conversion, and integration tool, has special features to accelerate data integration projects of all sizes.

For example, richly-formatted documents may include XML mixed content, a complex datatype that permits an XML element to contain text, attributes, and other child elements. Common instances of XML mixed content include blocks of text with tags for bold or italic fonts, or tags that select terms for indexing or other special treatment. Documents with XML mixed content can be difficult to include in a data integration project, since they appear to be free-form and unpredictable, with child elements that occur in any order or even multiple times within the parent.

Mapping_mixed_content

Read more…

Tags: , ,

XBRL Data Quality of SEC Filings in EDGAR


For fundamental investors probably the most important financial information to study are the financial reports from companies that they wish to potentially invest in. For publicly traded companies in the US, the SEC regulates what data needs to be reported and at which frequency, and investors typically access those financial reports through their own brokerage firm’s website, or through publicly available databases from other Internet providers. In addition, all the original filings from all companies are also directly available from the SEC in the EDGAR database. In addition to HTML and PDF versions of those financial reports, the EDGAR database also contains XBRL versions of those company filings since 2007, with the intent of making this data more easily comparable and directly consumable by computer programs for further analysis.

At least that is the goal…

In this article we’re going to look at some issues with the XBRL data quality of company filings in the SEC’s EDGAR database and show the surprising lack of correlation of high-level financial data extracted from the XBRL filings with publicly available financial data about US companies provided, e.g., by Yahoo Finance, Google Finance, and Fidelity Investments, as well as the shocking discrepancies found in the data reported by those separate services amongst one another.

Edgar_Validation

Read more…

Tags: , , , , ,

New Support for XPath/XQuery 3.1, WS-Security, and More Debut in R3


Release 3 of the Version 2015 Altova MissionKit desktop developer tools and Altova server software products is now available with updated standards support, customer requested features, and innovative new functionality that will save you time on everything from XPath and XQuery development, to advanced data mapping, to XBRL report rendering and beyond. You can skip right to the good stuff and upgrade now, or click Read More below for all the details.
clip_image005

Read more…

Tags: , , , , , , , , , , ,

New Data Integration Whitepaper Now Available


The data engulfing enterprises today comes from many seemingly unrelated sources. Collecting, refining, and assimilating all this information, and being flexible enough to accept new data formats and resources, is critical to success in the 24/7 connected world.

We are proud to announce a new whitepaper titled Data Challenges and the MapForce Platform for Data Integration that addresses these issues, now available for free download from the Altova Reference Library.

Mapping_mixed_content


This data integration whitepaper gives business executives, data analysts, data-focused developers and others an overview of current trends and issues in data integration, then discusses how Altova MapForce combines with Altova Server products to create a highly automated enterprise data integration platform that is configurable, scalable, and cost-effective.

To cover all the relevant, up-to-date information, the whitepaper even includes a section titled Data Integration for Mobile Devices that discusses how Altova MobileTogether easily integrates to bring data integration results to mobile devices, providing business intelligence dashboards, elegant enterprise forms, and much more in today’s cross-platform BYOD (bring your own device) workplaces.

Click here to download your copy today!

The MapForce Platfrom for Data Integration whitepaper

Tags: , , , , ,

Data Integration for Mobile Devices – MobileTogether Works with FlowForce Server


When an offsite manager can read and reply to company email on a mobile phone, it’s only a short step to wanting access to all up-to-the-minute company data from the most convenient device.

Previously we’ve written about using FlowForce Server to generate HTML output that communicates data integration results. And yes, HTML results can be made available to Web browsers on mobile phones and tablets, but that’s an inferior solution for several reasons – the data will be cumbersome to view because it is not formatted for each device, and there is no interactive support for user interface controls built into mobile operating systems like buttons, combo boxes, edit fields, etc.

Fortunately, FlowForce Server jobs can be triggered by Altova MobileTogether solutions. The results are delivered directly to the mobile device and presented in a beautiful native-client form.

Altova MobileTogether is a unique cross-platform mobile development solution that includes functionality to work with FlowForce Server, and by extension MapForce Server, to bring data integration results to mobile devices to integrate business intelligence dashboards, elegant enterprise forms, and much more.

Here’s how a month-to-date sales report can appear on a mobile phone as a MobileTogether solution:

Month-to-date sales report on a mobile device, created with MobileTogether

When the solution launches, the sales manager selects the region and product, the report is generated by execution of the FlowForce Server job running on a server back in the enterprise data center, and the results are displayed.

Read more…

Tags: , , , ,

Automating Data Integration Workflows – Download the E-Book


We’ve published an e-book titled Automating Data Integration Workflows with Altova FlowForce Server that is now available for free download from the Altova Web site.

Here is a brief description: FlowForce Server is a highly-customizable platform to automate data transformations defined by MapForce data mappings, report and document generation, and other tasks on dedicated servers, virtual machines, or workstations scaled for the scope of the project. FlowForce Server empowers data architects, analysts, and other IT professionals to efficiently complete enterprise-level data integration tasks.

Automating Data Integration Workflows with Altova FlowForce Server provides an overview of the Altova FlowForce Server platform through a series of real-world data integration tasks and examples.

Automating Data Integration Workflows with Altova FlowForce Server

The new e-book collects updated information from the Altova Blog, the Altova Web site, and some all-new material, organized in one location to help new FlowForce Server users get started and to suggest new applications and efficiencies for experienced users.

Read more…

Tags: , , , , , ,

Installing Altova Server Software in the Cloud


Cloud-first is becoming the new normal. At recent events we have frequently been asked about using Altova Server tools in the cloud. The answer is definitely, go for it. The installation is easy. In fact, we use Altova Server Software products ourselves for an internal reporting application, installed on local virtualized servers and on an AWS cloud instance. The charts below were generated by StyleVision Server running in the cloud to quickly communicate information about changes in dynamic data.

StyleVision Server is based on the built-in report and document generation engine developed for StyleVision and renders .SPS stylesheets originally designed in StyleVision, including features like a rich variety of charts to visually represent data.

In this post we will walk through the installation of FlowForce Server, MapForce Server, StyleVision Server, and RaptorXML Server for a complete data integration solution in the cloud.

Read more…

Tags: , , , , , ,

FlowForce Server Beta 3 is Now Available


Altova FlowForce Server Beta 3

MapForce 2012 users who need to automate data transformations in a centralized environment are enthusiastic about FlowForce Server, the new server product from Altova that automates execution of MapForce data transformations. Now we are pleased to announce the release of FlowForce Server Beta 3, offered as a free public beta test to all licensed users of Altova MapForce 2012 Enterprise Edition and MapForce 2012 Professional Edition.

The beta test period for FlowForce Server Beta 3 is extended until March 31, 2013.

FlowForce Server Beta 3 adds support for remote job requests via an HTTP client and job parameters that can be passed to any step in a job. When used together with the request interface, job parameters empower the HTTP client to specify input values in the job request.

FlowForce Server Beta 3 also permits any job to be called as a step within another job, implements individual job queues that make it possible to control server resources used by jobs, and adds many more refinements and enhancements.

FlowForce Server Beta 3 is available in a 32-bit version and a 64-bit version. The 64-bit version allows the MapForce Beta 3 module to process extremely large data files and provides compatibility with 64-bit database drivers.

Click here to read more about FlowForce Server Beta 3 at the Altova Web site, or visit the FlowForce Server Beta 3 download page to get started automating data transformations in your data center!

Tags: , ,

Resist Data Integration Redundancy


The Internet makes massive amounts of data available for lots of interesting applications. But whenever you design a unique analysis and presentation of information you don’t privately control, you risk that the owner will offer the same view at some point in the future, instantly making your application redundant.

That’s exactly what happened to the Groupon API data-mining project we originally wrote about in August, 2011. Fortunately, the core of our project is a MapForce graphical data mapping. We can quickly and easily tweak the mapping and repurpose it to present an entirely different data set that provides new value.

HTML output from MapForce and StyleVision

Read more…

Tags: , , ,

FlowForce Server Beta 2 is Now Available


FlowForce Server Beta 2 FlowForce Server, the new server product from Altova that automates execution of MapForce data transformations, has gained hundreds of enthusiastic followers since the release of FlowForce Server Beta 1 last December. Now we are pleased to announce the release of FlowForce Server Beta 2, offered as a free public beta test to all licensed users of Altova MapForce 2012 Enterprise Edition and MapForce 2012 Professional Edition.

The beta test period for FlowForce Server Beta 2 is extended until September 1, 2012.

FlowForce Server Beta 2 adds robust access control to segregate jobs and related data files, so departments can work independently without seeing or overwriting each other’s data. Access control functionality includes defined Users and Roles, Privileges, and Credentials, all managed by FlowForce Server Administrators.

FlowForce Server Beta 2 also includes Web interface enhancements to provide more status information about job schedules, active triggers, and more.

FlowForce Server Beta 2 is available in a 32-bit version and a 64-bit version. The new 64-bit version allows the MapForce Beta 2 module to process very large data files and provides compatibility with 64-bit database drivers.

Click here to read more about FlowForce Server Beta 2 at the Altova Web site, or visit the FlowForce Server Beta 2 download page to get a copy of the installers for yourself!

Tags: , ,

Announcing Altova FlowForce® Server Beta 1


Altova FlowForce® Server Beta 1 is an exciting new tool for execution of automated data mappings designed to provide comprehensive management and control over data transformations performed by dedicated high-speed servers, virtual machines, or even regular workstations, depending on the size of the task. To gather user input and accelerate product development, Altova is offering Altova FlowForce Server Beta 1 as a free public beta test to all licensed users of Altova MapForce® 2012 Enterprise Edition and MapForce® 2012 Professional Edition. Users employ Altova MapForce data mappings for two different types of data transformations:

  • One-time data conversions
  • Data transformations that are repeated by date or time, when new source data is available, or based on some other external event

While command-line execution, royalty-free code generation, and the MapForce API can assist with automation of repeated transformations, FlowForce Server Beta 1 provides much greater power and flexibility. FlowForce Server Beta 1 is a server-based tool with a Web interface that makes it much easier to implement, manage, or modify data transformation jobs in a busy data processing environment. FlowForce Server Beta 1 can administer multiple transformation jobs simultaneously, lets users define and adjust a variety of job triggers and actions on the fly, can perform housekeeping tasks like moving output files or cleaning up intermediate work, records detailed logs of all activity, and much more. FlowForce Server Beta 1 consists of four components that work together as illustrated in the diagram below. Altova FlowForce Server Beta 1 block diagram The FlowForce Server continuously checks for trigger conditions, starts and monitors job execution, and writes detailed logs. MapForce Server is an implementation of the MapForce Built-in execution engine that executes mapping packages previously deployed via the MapForce graphical environment. The FlowForce Web Administration Interface is a standalone web application that runs in an internet browser and provides the front-end of FlowForce Server. MapForce Beta is an enhanced version of the Altova MapForce application with an integrated deployment feature to deploy MapForce data mappings to a FlowForce server package. Altova FlowForce Server Beta 1 is available immediately as a free public beta test to all licensed users of Altova MapForce® 2012 Enterprise Edition and MapForce® 2012 Professional Edition. Visit the FlowForce Server Beta 1 page at the Altova Web site for more information!

Tags: , , ,

Processing the Groupon API – Epilogue


Rare edge cases can derail loosely coupled data mapping applications. This is especially true when you are consuming large datasets available over the Internet and have little or no influence over the source data. In this article we describe a debugging technique that lets developers working on data mapping and transformation projects quickly identify and accommodate unexpected data in a stream from a remote source. The Problem Last summer we wrote a series of blog posts describing how to work with the Groupon API to retrieve a subset of offers in all Groupon cities and format the list for a web browser or mobile device. MapForce output from the Groupn API, displayed on a mobile device We concluded with a command line to run a MapForce data mapping that calls the Groupon API over 150 times — once for each Groupon city, then filters the data to extract deals sold on the Internet instead of a physical location, and formats the results in HTML using StyleVision. Every morning we run the command line in a batch file that saves the HTML output on a local server so our colleagues can check it out with any Web browser to find interesting offers from all over the country. The mapping ran fine for more than two months until one day it failed with this error message: “Source-value “” of type dateTime could not be converted into target-type dateTime.” The specific explanation is that somewhere in the mapping where we expected a dateTime, we received an empty value. On a more abstract level, the error suggests a potential defect in the logic of our mapping strategy. Every time we call the Groupon API we receive a well-formed XML data stream enclosed in a <response> element, but the API specs do not include an XML Schema defining the data that may be returned. When we developed our mapping we needed to analyze the raw data and select the output we wanted, so our first step was to call the API to capture all the Groupon deals for one large metro area. We assumed we would get a large enough data sample to include every possible option in the API response. After our mapping ran successfully for two months, the API finally delivered a rare edge case that did not fit the pattern we expected. Debugging Tools MapForce provides debugging help. We can run our data mapping using the MapForce built in execution engine to see more details in the Messages window. MapForce Messages window siplays data mapping error The lines labeled Related location are hyperlinked back to components in the mapping where the error occurred. Clicking on the result error takes us to a format-dateTime function. format-dateTime function in MapForce We can either click the “” error or trace the value connector to identify the input element to the format-dateTime function. Either way, we locate the element that triggered the error. clip_image004 The suspect element resides in the input component that captures all the data returned by our calls to the Groupon API before any filtering or conversion takes place. When we designed the mapping, the endAt element in our sample data always reported the ending date and time for each Groupon offer, but for some reason we must have received an empty value in this field. If the error had occurred by running a local input file we could simply examine the file contents, but in this case the data came from multiple URLs, and is only held temporarily until it is mapped to the output component. Fortunately, we can apply a trick to easily modify the mapping and preserve all data received from the Groupon API. We simply copy the input component and paste a duplicate into the mapping. We can connect the response element from the original to the duplicate, which simultaneously maps all the child elements between the components. clip_image005 Our original input component is now connected to two output components. We can select which output component will be generated by the MapForce built-in execution engine by clicking the eye icon at the top right corner of any output component. The new output component simply saves a copy of everything in the input component. When we examine the raw data using XMLSpy, sure enough we find an empty element where we expected a date and time: clip_image006 The Solution Now that we know an offer might have no specific end time, we can plan for that possibility in the mapping. In the revised treatment of the endAt element, we do an if-test before the original format-dateTime function and provide an alternate output when the endAt element is empty. clip_image007 We had to work fast because all Groupon data is time sensitive. The edge case would eventually expire and disappear from the data stream. This experience showed us how important it is to have powerful debugging tools and to use them creatively, even after you think a data mapping project is running successfully! Altova MapForce is available in a free trial – the next edge case you solve could be your own. Editor’s Note: Our original series on mapping data from the Groupon API ran in three parts you can see by clicking the links here: Part 1 of Processing the Groupon API with Altova MapForce describes how to create dynamic input by collecting data from multiple URLs. Processing the Groupon API with MapForce – Part 2 describes how we filtered data from the API and defined the output to extract only the most interesting details. Processing the Groupon API – Part 3 describes formatting the output as a single HTML document optimized for desktop and mobile devices, and reviews ways to automate repeat execution.

Tags: , , , ,

Digging deeper with the Twitter API: iPhone 4S vs. Galaxy Nexus


We found some interesting data when we dug below the surface of the iPhone 4S vs. Galaxy Nexus debate using the Twitter Search API.In today’s world there is a vast quantity of data available online that can be used for research, market analysis, and competitive intelligence. While “Big Data” can be a problem for those who produce it, store it, and compile it, it is highly beneficial for those of us who are looking for answers.Some of that data is fortunately available to be queried online, and, in particular, there is a vast quantity of data on social media interactions out there.TweetsQueryingSearchAPIIn this article we will explore how to use the Twitter Search API from MapForce, Altova’s data mapping/conversion/integration tool, to aggregate data on recent user submissions (“tweets”) on two highly popular topics – the Apple “iPhone 4S” vs. the “Galaxy Nexus” as the latest hot Android phone – and extract some statistical data about the users engaged in those discussions. One of the benefits of this abundance of data available to us today is that we can query it in interesting ways and extract new meaning from it. While there are undoubtedly many existing services that already provide trends over Twitter topics (e.g., Trendistic), those services only offer very simple trends and do not allow us to query any deeper.But all of the underlying data is available for grabs if you are just willing to learn a tiny bit about web service APIs and how to use them to extract XML data for further processing. As a starting point, let’s use the Twitter Search API to query the stream of recent tweets for the last 100 postings that are about the “Galaxy Nexus”. The Usage Guidelines for Twitter Search tell us that using both words in a query will result in the use of the default operator, which is AND, so we are going to search for posts that contain “Galaxy AND Nexus”. So let’s try that and request the most recent 100 items:

http://search.twitter.com/search.atom?q=galaxy+nexus&rpp=100

If you follow this link, you will get a second window with a lot of raw XML data that is formatted according to the Atom Syndication Format specifications. Alternatively, you could request the data in JSON format, if you wanted to directly process it via JavaScript code by hand, but we will use the XML-based Atom format so that we can easily analyze the data and extract the information we want.Viewing the above search result in a browser is not very user-friendly, so we can take a quick peek at the XML data in our favorite XML Editor using the Open from URL function:TweetsAtomGridAs you can see, the data for each entry includes a language code, so for this example we will extract data from this Twitter feed as well as from a second search result on the “iPhone 4S” and combine them into one intermediate XML file for further analysis.Extracting XML data is really easy in MapForce: using the “Insert XML File” option to drop in an XML source, we can again specify the same URL as before. If needed, MapForce will automatically create an XML Schema for the supplied data so we can visualize it and extract information from it:TweetAtomMappingIn our mapping we have dropped in two sources on the left side – one using a query string to search for “Galaxy Nexus” and the other to search for “iPhone 4S” – and on the right side we have dropped in a simple XML Schema that will allow us to aggregate our data and analyze it more conveniently going forward. In this case the mapping between the two sides is straight-forward as we are only extracting basic information about the user, the date, and the language of the tweet, but in other applications the mapping could be more complicated and include functions as well as queries to other data sources, databases, or web services…Previewing the resulting XML data can be done directly inside MapForce using the output tab, and this is what we see as a result of our data transformation:TweetsRawDataNow we can easily use the reporting capabilities of StyleVision to group this data by language within each topic and count the number of posts in each language. We can then report this data in the form of pie charts, which produces the following interesting results:TweetsByLanguageObviously, this data is highly dependent on the date of execution and time of day, as well as the particular announcements happening about these products, so the numbers will fluctuate quite a bit, but it can be used as a nice monitoring for seeing different language-specific trends. And once this has been set up, the report can be refreshed easily with the click of a button to get a snapshot at that point in time. For more long-term analysis it would of course be necessary to modify the mapping a bit to query more than 100 recent tweets.In this article we have used Twitter’s Search API as one example data source and only looked at language as one unique data point, but there are many more interesting sources of data available online today, and this approach can be used on all of them in a similar fashion.If you want to experiment with other data sources and other kinds of information that you want to extract, we invite you to try for yourself. A free 30-day evaluation version of MapForce is available, and there are no limits on how you can use the other features of Altova’s data mapping and conversion tool for data processing tasks that go beyond analyzing social media trends…

Tags: , , , ,

January 1 HIPAA Deadline Has Wide Impact


Every day tens of thousands of encrypted data transactions occur between health care providers, pharmacies, insurers, medical billing services, and employers who provide worker health coverage. Everyone in the United States covered by health or dental insurance depends on the automation, accuracy, and security of these largely unnoticed data streams to verify eligibility and process payments for nearly all medical services. Definition of messaging standards for these transactions are mandated by HIPAA (Health Insurance Portability and Accountability Act), passed in 1992 and administered by the Department of Health and Human Services. By January 1, 2012, all health care enterprises covered under HIPAA are required to transfer data in version 5010, the latest HIPAA standard, based on ANSI X12.

Migrating Existing Data Formats To and From the Latest Standards

Altova MapForce is a powerful and flexible tool used by developers and IT professionals in many industries to automate today’s complex data conversions. The screenshot below shows a portion of a real-world example of a complex HIPAA data mapping in Altova MapForce from one state’s ANSI X12 eligibility file to integrate membership file data for public sector healthcare.  

HIPAA Data Mapping

Altova MapForce 2012 enables visual mapping to and from all transaction sets that are required to comply with HIPAA regulations. If you are a developer working for an organization in the healthcare industry, you can map HIPAA messages to or from XML, databases, flat files, Excel 2007+, and Web services, then generate royalty-free code in Java, C#, or C++ for your data transformation to integrate internal healthcare data formats and the HIPAA standards. MapForce includes an example mapping from a HIPAA message to XML format, along with a sample data file and XML schema, so you can generate XML output using the MapForce built-in execution engine. The screen shot below shows the MapForce example mapping, including the pop-up help available by rolling the cursor over any HIPAA message element.   MapForce HIPAA example mapping MapForce allows users to apply mathematical, string, or logical functions, and other conversions, as data is transformed between the source and destination, illustrated by the parse-date function at the bottom center of the mapping image. Of course, privacy issues forbid distribution of an actual patient health care record, so the MapForce example HIPPA message content shown below is describing a fictitious person, but the message format is valid and the example is an effective demonstration of mapping functionality. When you click the Output button at the bottom of the mapping window, MapForce extracts the selected fields from the sample HIPAA message and transforms them to the XML version.   XML Output from HIPAA example For one-time data conversion needs, MapForce lets you save the results displayed in the Output window. MapForce also integrates with Altova StyleVision to apply style sheets that format data mapping output to HTML, RTF, PDF, or Microsoft Word formats.

HIPAA Message Formats Supported by MapForce

MapForce supports version 5010 for all the following key X12 transaction types included in the HIPAA January 1, 2012 mandate:

  • 270-B1 — Health Care Eligibility Benefit Inquiry
  • 271-B1 — Health Care Eligibility Benefit Response
  • 276-A1 — Health Care Claim Status Request
  • 277-A1 — Health Care Information Status Notification
  • 277-B3 — Health Care Claim Acknowledgement
  • 278-A1 — Health Care Services Review – Request for Review
  • 278-A3 — Health Care Services Review – Response
  • 820-A1 — Payroll Deducted and Other Group Premium Payment for Insurance Products
  • 834-A1 — Benefit Enrollment and Maintenance
  • 835-W1 — Health Care Claim Payment/Advice
  • 837-Q1 — Health Care Claim – Professional
  • 837-Q2 — Health Care Claim – Dental
  • 837-Q3 — Health Care Claim – Institutional
  • 999-A1 — Implementation Acknowledgement for Health Care Insurance

You can also use the example mapping to generate code and compile it to experiment with interfacing a data mapping application to your existing health care records infrastructure.   MapForce code generation menu HIPAA data mapping is only one application for the any-to-any graphical data mapping, conversion, and integration functionality of Altova MapForce. If you are interested in trying MapForce for your next data conversion project, you can click here to download a fully functional 30-day trial.

Tags: , , ,

Processing the Groupon API – Part 3


Concluding the series in this post, we will apply a stylesheet to transform the XML data created from our mapping of the Groupon API into HTML. Here is an example of the XML output from the data mapping we created last time: XML produced by MapForce from the Groupon API

Assign a Stylesheet to Transform XML The Component Settings dialog for the output component of the MapForce mapping allows us to assign a stylesheet created with Altova StyleVision.

Assigning a StyleVision Stylesheet to a MapForce component
Assigning a stylesheet to the data mapping output component integrates the operations of MapForce and StyleVision, and a new series of buttons appears at the bottom of the MapForce mapping window for HTML, RTF, PDF, and Microsoft Word formats. (You must have both MapForce and StyleVision installed on your computer.) MapForce ouput formats available through a stylesheet When you click any of these output format buttons, MapForce executes the data mapping exactly as we saw in the previous post. MapForce seamlessly passes the XML output to StyleVision, where it is transformed to the selected format. MapForce then displays the formatted document in the Output window. Here is the MapForce Output window for HTML, based on the StyleVision Power Stylesheet assigned above: HTML output produced by MapForce from the Groupon API The MapForce Output menu lets you save the XML data mapping output or the HTML document formatted according to the stylesheet. How to Make a Stylesheet We designed a stylesheet for the Groupon API data mapping using Altova StyleVision, based on the XML Schema for the MapForce output component. The intuitive StyleVision interface and powerful data access and manipulation features make it easy to create attractive documents in HTML, RTF, PDF, and Microsoft Word formats from XML files. The screenshot below shows the StyleVision Design View of the Extreme Groupon stylesheet. The blue numbered circles identify the location of each design feature listed following the image. StyleVision stylesheet for the MapForce Groupon API mapping Features of the SPS file

  1. User-defined html specifies the viewport meta tag for mobile devices. This lets us design one stylesheet to generate a single HTML file for computers and mobile devices
  2. Document title with customized font, size, and color
  3. An autocalc element uses the XPath count function to count the number of deals in the XML input document and inserts the total
  4. The date timestamp is placed at the top of the document even though the date element occurs at the end of the XML input data file
  5. Images from the Altova and Groupon Web sites are referenced by hyperlinks, not as inline image data
  6. Horizontal rules set off each individual deal. For HTML documents, the rules automatically fit the browser window width
  7. Customized fonts and sizes assigned to different elements
  8. A two-column table organizes each deal description
  9. URLs in the XML file are dynamically assigned as hyperlinks for embedded images, fixed text, and dynamic data

StyleVision Power Stylesheets can combine multiple .xsd files, existing .css stylesheets, database schemas, XBRL taxonomies, and more to produce richly formatted reports that can even include automatically generated charts in various styles. You can also use StyleVision to define e-forms with data entry fields, drop down menus, radio buttons and other advanced features. Previewing Stylesheet Transformations StyleVision lets you assign a working XML file to preview your output as you design the stylesheet, and the buttons along the bottom of the Design window make it convenient to display the formatted working file as you refine your design. We saved the XML output of the MapForce mapping and assigned it as our working document. When the stylesheet was complete, the HTML Preview in StyleVision was identical to the MapForce HTML Output window shown above. To view the document on a mobile device you can either deploy the HTML as a page on a Web site or email it as an attachment. HTML version of the MapForce mapped data on a mobile device In addition to the stylesheet itself and formatted versions of the working document, StyleVision lets you save generated XSLT files to transform other XML files using your stylesheet design outside the StyleVision application. Automation Next Time In the future when you want to re-run a data mapping and refresh the HTML document with up to date data, there are two ways to automate the process:

  • You can run MapForce from a command line with parameters to name the mapping definition file and even call StyleVision to create formatted output
  • You can generate royalty-free code for the mapping in XSLT, Java, C++, or C# to combine with the XSLT code from StyleVision to build your own end-to-end application

XMLSpy, MapForce, and StyleVision are all available together in the specially priced Altova MissionKit. See for yourself how easy it is to use the MissionKit to convert data from a Web API — download a free 30-day trial!
Editor’s Note: Our original series on mapping data from the Groupon API ran in three parts you can see by clicking the links here: Part 1 of Processing the Groupon API with Altova MapForce describes how to create dynamic input by collecting data from multiple URLs. Processing the Groupon API with MapForce – Part 2 describes how we filtered data from the API and defined the output to extract only the most interesting details. Processing the Groupon API – Part 3 describes formatting the output as a single HTML document optimized for desktop and mobile devices, and reviews ways to automate repeat execution.

Tags: , , , , , , , ,

Processing the Groupon API with MapForce – Part 2


In Part 1 of this series we described how to connect Altova MapForce to the Groupon API. We queried the API for a list of Groupon divisions, then used the list to create API queries for all the current deals from every division. In this part, we will execute the /deals queries and filter the response for the most interesting data. The list of /deals queries we built previously looks like this: List of Groupon /deals queries generated by Altova MapForce To process all the queries, we can connect the list as a dynamic file input to a new mapping component. When we needed a new component last time, we dropped an API /divisions query into the mapping, and let MapForce create an XML Schema automatically. We could do the same thing here by dropping in an API /deals query as an XML input file. There’s just one small issue — although the Groupon API online documentation clearly describes the queries we can make, it is vague about the information that will be returned. Before we send dozens of queries to the API for all the current deals, we probably want to know a little more about the data that will come back.

Let’s Make a Deal Like Yogi Berra said, you can observe a lot just by looking. Let’s start by running a /deals query in XMLSpy. That will let us examine the response to a query for one division before we pull in a potentially unwieldy volume of data. The XMLSpy File / Open menu includes the same Switch to URL option we used in MapForce in the earlier post. If we enter the /deals API query for a division that covers a large metro area – say Dallas – we are likely to get enough deals instances to extrapolate the characteristics of the entire data set. XMLSpy opens the response to the /deals API query in Text view just as if we opened a local file: Example from the response to a Groupon /deals query, shown in XMLSpy As expected, we got quite a bit of data when we requested all the deals for a single division! A fast way to analyze the structure of this data is to use the XMLSpy DTD / Schema menu option to generate an .xsd file from the xml. Shown below is a reduced view of the entire generated .xsd file based on the response to the /deals query for Dallas: An xsd file generated by XMLSpy from the Groupon query We can dig even deeper, following Yogi’s advice like déjà vu all over again. Expanding all the elements to review the XML Schema reveals some curious anomalies. For instance, there are two elements named redemptionLocation with different definitions. The first contains a sequence of child elements: First use of the remdemptionLocation element And the second is defined as a simple string: Second use of the remdemptionLocation element Going back into the xml data for Dallas and searching for redemptionLocation displays these examples: One example of redemptionLocation in the body of the response And: One example of redemptionLocation in the body of the response And: One example of redemptionLocation in the body of the response Now this is really interesting, because redemptionLocation = ”online” identifies deals that can be redeemed from anywhere, instead of by a visit to a bricks and mortar location in the division where they are advertised. What if we ran the /deals API queries for all divisions and extracted a list of all the online deals? That would be one extreme Groupon! Only Ask for What You Need The Groupon /deals API query supports an optional parameter called &show= that allows users to limit the data returned. Applying this parameter can save bandwidth and reduce processing time for the data transformation by removing unwanted data from the API response. We can also simplify our final result by including only the most interesting information, including the link to the Groupon web page for each deal. After we remove unwanted elements from the generated Dallas schema, our final version for the summary of online deals looks like this: XMLSpy Schema diagram of the simplified Groupon xsd file When we add the &show= parameter to our MapForce mapping to request only the elements included in the simplified XML Schema, the queries look like this: Modified list of queries with the &show= parameter Now we can drop the revised .xsd file into the mapping and connect the list of API /deals queries as dynamic input. We don’t need to delete the text file we used to collect the list of queries — that might continue to be helpful for future debugging. Mapforce dynamic input file mapping These changes complete the input side of the data mapping. Defining the Data Transformation Output Back in XMLSpy we can make a couple more revisions to the input XML Schema to design a new version for output: XMLSpy schema diagram of the output file xsd We discarded the response element since it doesn’t add any value, and eliminated the redemptionLocation element that we don’t intend to include in the output. We also added a date element for a timestamp, because our output file will be a snapshot of data that is constantly changing. After saving this version of the .xsd file in XMLSpy, we can drop it into the MapForce mapping. Shown below is the output side of the mapping with the output component partially connected. The filter at the top reads the redemptionLocation element to select only online deals and the now function inserts the date: Partial view of the MapForce output file mapping The last revision we made in the output XML Schema was to change several element types from dateTime, Boolean, and integer to the string data type to allow more descriptive text Here is the complete definition of the mapping with the final connections to the output component: Mapforce data mapping for the Groupon API Now for the Payoff When we click the Output button MapForce processes the entire mapping from beginning to end using the MapForce Built-in execution engine. Here’s a breakdown of the steps:

  • Run the /divisions query to get the current list of divisions
  • Concatenate strings to build the list of /deals queries for all divisions
  • Run the /deals queries to create dynamic data for the input component
  • Filter for online deals to generate the output component, execute the remaining mapping functions, and add the timestamp after all the deals are processed

MapForce takes only a few seconds to complete all those steps and generate an output file with a series of deals that look like this: Output data from the MapForce mapping for the Groupon API In part 3 of this series we’ll design a stylesheet to automatically transform the XML output of our mapping into html for attractive presentation in a web browser and on mobile devices. See ya at the ballpark, Yogi! XMLSpy and MapForce are available together in the specially priced Altova MissionKit. See for yourself how easy it is to use the MissionKit to convert data from a Web API — download a free 30-day trial!
Editor’s Note: Our original series on mapping data from the Groupon API ran in three parts you can see by clicking the links here: Part 1 of Processing the Groupon API with Altova MapForce describes how to create dynamic input by collecting data from multiple URLs. Processing the Groupon API with MapForce – Part 2 describes how we filtered data from the API and defined the output to extract only the most interesting details. Processing the Groupon API – Part 3 describes formatting the output as a single HTML document optimized for desktop and mobile devices, and reviews ways to automate repeat execution.

Tags: , , , , , , ,

Processing the Groupon API with Altova MapForce


We often think of a data integration project as a translation from one singular data input file to some other data set, but Altova MapForce lets you greatly expand the concept of an input file. For instance, the MergeMultipleFiles.mfd example installed with MapForce illustrates how you can use a filename with wildcard characters to merge multiple input files into a single output. MapForce MergeMultipleFiles.mfd example A MapForce mapping input doesn’t even need to be a physical file – it can be a URL that returns predictable structured data, like the APIs for popular Web sites like Groupon and many others.

In this blog post we’ll describe how to use Altova tools to retrieve, filter, analyze, and present data available from a Web-based API, using Groupon as an example. If you want to follow along yourself, you will first need to visit http://www.groupon.com/pages/api to request your personal Groupon API client key. The Problem: All Deals Are Local The Groupon Web site and email subscriptions are great for finding deals in your local neighborhood, but what if you’re looking for a deal to use on an upcoming vacation, or for a gift for friends or family across the country? Sure, you could enter each location manually at the Groupon Web page, but that’s so last century. Let’s use the Altova MissionKit to automate things. The Groupon API offers two URL queries that return data in .json or .xml formats: the first returns a list of all Groupon localities (called divisions), and the second returns current deals information for one named division. If we want to see all the deals for more than one division, we need to resolve multiple URLs and aggregate the data into a single result. Yes, MapForce can do that! First We Need a Schema The Groupon API documentation describes the elements that will be returned by our requests, but doesn’t provide an XML Schema. That’s okay, we can use MapForce to generate one. All we have to do is open a new mapping design and choose Insert XML Schema/File, then click the Switch to URL button. Now we can enter the URL to retrieve the Groupon divisions list: Inserting a new component into a MapForce mapping by URL When we click the Open button MapForce offers to generate the schema: MapForce offers to generate an XML Schema When we click Yes, the File / Save dialog opens. I saved the schema as divisions.xsd, and the mapping with the new XML Schema inserted looks like this: Generated .xsd as a new component in a MapForce design And the Properties dialog for the XML Schema component automatically contains the API /divisions URL as the Input XML File: Component properties for the generated .xsd Check the Work We want to filter the Groupon divisions data to build a list of id names to use for deal queries for each locality. But before we go any further, now might be a good time to apply the text file trick from the Quick Solution for Complicated Functions blog post to look at the id values. When we insert the text file and connect the divisions and id schema elements, the mapping looks like this: MapForce design with text file to preview output We connected the division element to Rows in the text file in order to generate a new row in the text file for each unique division, so that Field1 in each row will hold the id. Clicking the Output button now generates this result: MapForce Output window All we need to do is apply the concat string function to build the list of /deal URLs for all division IDs. The next step in the mapping looks like this: Using the MapForce concat function to build a string Rolling the cursor over the constant connected to value1 of the concat function displays its full definition: Definition of a MapForce string constant When we click the Output button to execute the mapping, the Output file now looks like this: MapForce Ouput window As a further review, we can open the generated XML Schema in XMLSpy and display it in graphical Schema View: Altova XMLSpy graphical schema view of the generated .xsd So far we have:

  • built a MapForce mapping that queries the Groupon API for all divisions
  • extracted the division id fields
  • and built a list of URLs for API queries to get the deals in each division

In the next post in this series we will process the list of deal queries as the input for a new mapping component and filter the output for some interesting information. Find out for yourself how easy it is to apply MapForce to convert data from a Web API! Download a free 30-day trial of MapForce.
Editor’s Note: Our original series on mapping data from the Groupon API ran in three parts you can see by clicking the links here: Part 1 of Processing the Groupon API with Altova MapForce describes how to create dynamic input by collecting data from multiple URLs. Processing the Groupon API with MapForce – Part 2 describes how we filtered data from the API and defined the output to extract only the most interesting details. Processing the Groupon API – Part 3 describes formatting the output as a single HTML document optimized for desktop and mobile devices, and reviews ways to automate repeat execution.

Tags: , , , , , ,

A Quick Solution for Complicated Functions


Some data conversions require multiple steps to satisfy today’s complex data communication requirements. Altova MapForce 2011 lets you graphically combine a wide variety of mathematical, logical, string, and other specialized functions to build complicated "data equations" to get the results you need. If you’re working on a big, complicated mapping, if you’re using an unfamiliar function for the first time, or when your function creates an intermediate result that needs further processing, it is helpful to test your work each step of the way as you build. You can use a simple text file as a temporary target to see the output of your function under construction. Let’s say we want to add a date and time stamp to an existing mapping of an output file to record the time the data was generated. We can easily experiment with the MapForce now function in a new mapping that simply connects now to a text file. A function connected to a text file Clicking the Output button at the bottom of the mapping window shows us the immediate result:

Output of the now function Okay, that works, but maybe the consumer of the output file would like to see a more elegantly formatted version. We can work with various datetime and string functions and build a complicated function until our mapping looks like this: Complicated function to produce a string Or we could simply use the format-dateTime conversion function with a string constant to define the format: Using the format-dateTime function for customized output As we work, we can press the Output button at any time, until we are satisfied with a result that looks like this: Custom string for date and time If you don’t work with dateTime data types every day, it’s hard to write a format string on your first try that generates the desired result! After several attempts, variations, and consultations with MapForce Help, here’s the format we developed and stored in the string constant connected to the format input of the format-dateTime conversion function: String to define format for dateTime So far we used a text file that was defined as a basic CSV file with only a single field, but you can open the file Properties dialog and add fields or create a more customized output file. Properties settings for a simple text file One advantage of using a text file as the output target is there is no type checking of the function result, so the text file target lets you examine and verify the output of any function. In the screenshot below we created a mathematical function and added a second field to the text file target to map the result. Text file with two target fields Now the output is a single-row, comma separated result like this: Two fields in a simple text file If our ultimate target is going to be a database field or an XML element with an integer data type, then we can immediately see this mathematical function doesn’t produce the expected datatype. When you have perfected your function in the test mapping, you can simply select, copy, and paste it directly into your larger mapping. You can then connect the output of the function to your ultimate target. In the screen shot below our format dateTime function is mapped to an element in an XML schema that is defined as a string. Function pasted into larger mapping If this is a function you are likely to want again in the future, you can convert it to a User-Defined Function and save it in your library for convenient reuse. Altova MapForce Function menu You can even use a text file as a temporary target to build and test a complicated function right inside your larger mapping. In that case, your mapping includes multiple possible outputs. The eyeball button at the top right of each output file selects which output file is displayed in the Output window. Text file as a temporary target in a larger mapping When you select the text file as the Output preview, the MapForce execution engine does not process the larger mapping, only the function connected to the text file. This can be a huge time-saver when you just want to examine the function result and your larger mapping processes a large volume of data, or if you don’t want to risk inserting invalid data into a database, and in many other situations. Find out for yourself how easy it is to apply MapForce to your own data mapping projects! Download a free 30-day trial of MapForce.

Tags: , , ,

Switch Statement vs. Look-up Table in MapForce


One of the great things about working with software developers is you not only get to create new things that never existed before, you also get to see how other peoples’ minds work when they discover alternate solutions to any design challenge. We received a comment from a software developer on our recent post titled Expandable If-Else Works like a Switch Statement in MapForce regarding one of the examples we used. The reader suggests that our second example illustrated a problem that would be more elegantly solved in Altova MapForce with Value-Map than by our Expanded If-Else statement. Here was the original example that received the month as a string of characters and needed to generate the corresponding number: Original Expanded If_Else example in MapForce A Value-Map in MapForce is an alternate solution that functions as a look-up table, whereas an Expanded If-Else acts like a switch statement. Here is how our mapping would look with a Value-Map in place of the Expanded If-Else: Value-Map alternative in MapForce Yep, that’s it. Rather than copying, pasting, and modifying sets of elements the way we built our original Expanded If-Else, a Value-Map lets us easily create the entire look-up table in its Properties dialog: Value-Map Properties dialog in MapForce We accept the commenter’s point — Value-Map definitely works better for the problem we chose because it’s much quicker and easier to create! The table from the Value-Map properties is also more concise and easier to interpret in MapForce-generated mapping documentation than our original Expanded If-Else structure. Of course you can’t always replace an Expanded If-Else statement with a Value-Map. Data entering the Value-Map must equal a single value in the input table to generate a specific output, whereas Expanded If-Else lets you set up a series of conditions with different logical tests. Sometimes the exact nature of a data conversion project makes it a judgment call to use a switch element vs. a look-up table. Let’s say your project receives input as a number that represents a wavelength of the electromagnetic spectrum and you want to handle ultraviolet, visible colors, and infrared energy individually. In that case we could use an Expanded If-Else to test for ranges of input values. The Expanded If-Else section of the mapping might look like this: Expanded If-Else mapping in Altova MapForce If the input is an integer, you could also create a solution using Value-Map, but you would need to build a very long look-up table. And then what happens later if the project requirements change and the input becomes a decimal number, or you need to filter each visible color separately by name? Essentially Altova MapForce is a really cool graphical representation of a complete software language toolbox that insulates you from detailed programming language syntax, with a rich collection of components you can assemble creatively to solve your own data mapping, conversion, and integration challenges. Find out for yourself how easy it is to apply MapForce to your own data mapping projects. Download a free 30-day trial of MapForce.

Tags: , , , , , ,

Harness the Power of Chained Transformations in MapForce


Altova MapForce includes the ability to define chained transformations. Chained transformations let you create complex mappings where the output of one mapping becomes the input to another. In other words, two or more components can be directly connected to a final target component. MapForce chained transformation example

Read more…

Tags: , , , , , , , ,

New Software Release : MapForce 2011


  clip_image002 On September 8, Altova released v2011 of the MissionKit with powerful new features across the entire product line. MapForce has benefitted from the addition of advanced data integration functionality like chained transformations, integration with StyleVision for rendering transformation output, new formatting functions, and extended support for the UN/EDIFACT and ANSI X12 EDI formats. Let’s take a closer look at the exciting new features in MapForce 2011 including:

  • Chained transformations
  • Integration with StyleVision for output components
  • Formatting of numbers, dates, and times
  • Extended support for EDIFACT
  • Extended support for X12

Chained transformations Support for chained transformations lets you create complex mappings where the output of one mapping becomes the input of another. This is a powerful feature that adds to MapForce’s ability to execute fully automated transformations. Each chained component becomes a modular entity in an interdependent transformation sequence, allowing for conversions to be made on-the-fly. You can create chained transformations using any number of mapping components connected to a final target component. Preview and code generation features can be displayed/generated for intermediate components, as well as for the final mapping result. Intermediate mapping components also now have a "pass-through" button in the title bar that lets you define the set of data that gets passed on to the following component.  

clip_image003

For example, the mapping above shows a chained mapping where the pass-through button is active and sample data is assigned to component A. The output preview offers two separate sets of data: XML that conforms to the Contacts.xsd schema and incorporates a subset of data mapped from the Employees.xml sample file, and XML that conforms to PersonList.xsd using data from the Employees sample file. In both cases, the data has been amended with the relevant constants and functions that are shown in the MapForce design pane.   clip_image004 Integration with StyleVision for output components Support for Global Resources throughout the MissionKit has already offered you some integration between Altova software applications… But this feature takes that integration to a whole new level, allowing you to render XML and XBRL output from your data mappings into HTML, RTF, PDF, and Word 2007+ using an associated StyleVision template design. This essentially combines MapForce’s any-to-any data mapping capabilities with a sophisticated rendering engine, meaning that you can now automate report generation from virtually any data format that can be mapped to an XML Schema or XBRL taxonomy. In the example below, a StyleVision design has been associated with the mapping by simply right-clicking the output file and browsing to select a suitable SPS file using the Component Settings dialog.   clip_image005   Once the SPS file is entered or selected, you will be able to simply click on the relevant format tab (i.e., HTML, RTF, PDF, or Word 2007+) to view rendered data.   mapforce-html Formatting of numbers, dates, and times Probably one of the most requested features, this lets you easily convert numbers, dates, and times to their string representations using several different formatting functions. For example, the simple format-number function below converts a numerical input (e.g., 12345) to a monetary one in with a USD prefix, comma separating the thousands digits, and two decimal places (e.g., $12,345.00).   format-number   This post really just scrapes the surface of what the new MapForce release has to offer -download a free 30-day trial of Mapforce today to experience all of these new features and more!

Tags: , , , , , ,