Altova first added support for charts and reporting the Altova MissionKit with the launch of Version 2011 last September. The v2011 reporting functionality includes options for line charts, 2D and 3D bar charts, 2D and 3D pie charts, round gauge and bar gauge charts. Here are a few examples: 
Advanced chart features in v2011r2
Version 2011 Release 2 of the Altova MissionKit, introduced on February 16, adds an exciting group of enhancements to the chart and reporting features in XMLSpy, StyleVision, and DatabaseSpy. The chart design options and user interface work the same way in all three applications, so MissionKit users can work intuitively and productively as they move from processing XML data in XMLSpy, to preparing charts for a business intelligence report with StyleVision, and even when they create graphical displays directly from SQL query results in DatabaseSpy. The wide range of new customizable charting features introduced in version 2011 release 2 includes:
- Stacked Bar charts
- Area charts
- Stacked Area charts
- Candlestick charts
- Chart overlays
- Background images and color gradients
- Ability to change position of axis labels
- And more!
Now you can create attractive and informative charts to represent a wide variety of data sets without exporting data to a dedicated charting application. Charts created using the Altova MissionKit are not limited to any specific presentation technology – for instance you can use StyleVision to include charts in HTML, Microsoft Word, RTF, or PDF documents, or you can save charts created in DatabaseSpy in a variety of image formats at the custom resolution you specify. In this post we will show some examples of the new charts and features available in all three MissionKit reporting and charting applications – XMLSpy, StyleVision, and DatabaseSpy.
Stacked bar charts
Stacked bar charts are a variation on bar chart presentation and are especially useful when multiple ranges of data need to be illustrated. Stacked bar charts are also useful to more clearly illustrate data in a smaller area. The image below shows a stacked bar chart to illustrate the performance of a sales team by region over two years  Note that the combined height of each stack in the Stacked Bar Chart represents the total sales over the two-year period for each Territory, since the sales for Last Year are added above the Year To Date numbers. Stacked bar charts complement regular bar charts and 3-D bar charts to offer users the greatest flexibility in illustrating SQL query results. If the user prefers horizontal bars, a checkbox labeled Draw X and Y exchanged in the Change Appearance tab selects that orientation.
 This orientation option is also available for other 2-D bar charts, line charts, area charts, and candlestick charts.
Area charts
Area charts are similar to line charts, with shading applied to make a more graphically appealing display. The area chart below shows a record of temperature and humidity changes by hour over the course of one day. Creative application of color can emphasize the point!  To successfully build an area chart, the analyst must consider the values in each data category. As the area chart is constructed, each category forms an opaque layer on top of the layers for data retrieved previously. In the case illustrated above, Temperature was always a larger number than Humidity, so a SQL query was constructed in DatabaseSpy to retrieve the Temperature value before Humidity to prevent Temperature from acting like a curtain to hide the Humidity data. However, if the data columns appear in a sequence with values in increasing order, the last layer would overlap and hide all the preceding layers. In that case, the chart tab heading titled Select Data lets the user add and delete columns from the results to re-sequence the data correctly. The Select Data column also lets the user edit the names assigned to each column on the X-axis label.
  As alternative solution, the Transparency option in the Change Appearance tab lets the user adjust color levels to allow hidden layers to show through.
 |
Stacked area charts
As implied by their name, Stacked Area charts layer the columns of a data set to illustrate the overall sum of a data series. Stacked Area charts also eliminate the potential overlapping data problem that can occur with regular area charts. The chart below shows a table of air passenger revenue miles traveled by month, with individual regions for domestic and international travel.  The Stacked Area chart creates a graphical representation of the total of Domestic and International miles, even though the total miles value was not part of the provided data. This is apparent at the top of the January entry, where the International region intersects the Y axis just below 600 (the original data showed 392 million Domestic miles and 181 million International miles, for a total of 573). A strategic data analyst will always consider the nature of the data to be reported when choosing any particular chart type. For instance in the weather example we used above, adding temperature and humidity values in a stacked bar chart would not be logical!
Candlestick charts
Candlestick charts were originally developed by a wealthy Japanese businessman who began trading at the local rice exchange around the year 1750. He kept records of the local market psychology, learning to boost his profits by carefully monitoring prices and not rushing into trades. Today, charts are used to represent financial data such as stock prices over a period of time. Every day the market is open, each stock has four relevant data points that can be rendered in a candlestick chart: the price at market opening, the price when the market closed, the high price during the day, and the low price during the day. Investors and financial analysts like to view these indicators to gauge the stock’s performance over a period of time. In the candlestick chart below, each solid bar represents the range between the opening and closing price and the thin vertical line through each bar shows the extent of the high and low prices for the day.  In this version of the chart, following common convention, the color of each bar signals whether the stock was up or down for the day. If the bar is green, the stock was up for the day– it opened at the price indicated by the bottom of the bar and closed at the price indicated by the top. If the stock was down for the day, the bar is red and the symbolism is reversed – the stock opened at the price indicated at the top of the bar and closed at the price shown by the bottom. Numerous options are available to set line and fill colors, the Y-axis range and values, and more. Because they were intended to be printed in black and white, the original candlestick charts used empty bars to indicate the price increased and solid bars to indicate price decreases. The Altova MissionKit offers this option:
  Another candlestick chart variation omits the opening price and simply illustrates the range by a vertical line and the closing price by a horizontal line. This option is automatically supported when a data set only includes the high, low, and closing prices.
Chart overlays
The Overlays feature lets you combine multiple charts in a single image. Each overlay chart has unique settings and can even be generated from a separate data file. The image below shows a candlestick chart of a stock’s daily prices with the daily sales volume in a bar chart overlay. 
Support for background images & color gradients
The ability to specify background color gradients and background images gives you even more flexibility for creating customized, eye-catching charts. Overlaying one chart on another lets you visualize multiple data sets with different Y-axes and types.  The Change Appearance dialog lets users select a background image, as in the Winter Games chart above, or apply a background color gradient, as in the Summer 2010 chart below.
 If you’d like to see for yourself how easy it is to use Altova tools to create attractive charts from XML and database data, download a free trial of the Altova MissionKit.
Leverage Your Financial Data with the XBRL Chart Wizard–Part 2
Extensible Business Reporting Language (XBRL) is an XML-based language for reporting and exchanging financial data that’s making inroads across the globe. In fact the US Securities and Exchange Commission now requires public companies to submit financial data in XBRL format.Altova’s MissionKit, a suite of our most popular software, supports XBRL tagging via XMLSpy and MapForce as well as XBRL rendering via StyleVision. With StyleVision you can create sophisticated financial reports including charts and tables based on XBRL instance files. This is the second post in our two part series on StyleVision’s XBRL chart capabilities. In our last post we showed you how to call the XBRL Chart Wizard and create pie charts. This time we’ll show you how to create bar charts and line charts. Bar Charts Bar charts are the ideal vehicle for comparing groups of objects or visualizing change from one period to another. Here we’ve used the XBRL Chart Wizard to create a bar chart comparing Current Assets to Current Liabilities from the third quarters of two consecutive years. After invoking the XBRL Chart Wizard as we did in the very first step, we select Current Assets and Current Liabilities in the Concepts tab and place it in the Series pane so that these amounts will be reflected on the Y or vertical axis.
  Now we click the ellipses in the Period tab in the Categories pane to bring up the Period Properties dialog box. Assets and Liabilities are measured at specific points in time and so we have checked the Show instant periods box. We’ve also filtered the data using XPath so that only assets and liabilities at the end of the third quarter (which ends in August) appear. Finally we add a dynamic label that combines “Q3” with the year using XPath.
  In addition to the bar chart, we’d like to include the Quick Ratio, a measure that indicates whether an organization has enough readily liquidated resources to cover outstanding financial obligations. The Quick Ratio is simply Current Assets divided by Current Liabilities. We’ve added an auto calculation and used XPath to divide Current Assets by Current Liabilities for all time periods in the XBRL instance document. Below is the design view of our bar chart and auto calculation, including the XPath.
  The HTML output appears below. However we can also render the design in RTF, PDF, and Word 2007+.
  Line Charts A line chart has a line connecting discrete points plotted on a graph and is typically used to track how financial and other data varies over time. In this example we’ve created a line chart to track two concepts – costs / expenses and revenue – over a four year period. Just as we did for the pie chart and bar chart, we’ve dragged a concept (here, Revenues) from the Schema Tree into the design window and invoked the XBRL Chart Wizard. Likewise, once the Chart Wizard opens, we clicked on the ellipses on the Concepts tab in the Series pane to bring up the Concept Properties dialog box, where we selected the Costs and Expenses concept. Costs and Expenses will now appear on the chart along with Revenues. Our XBRL file includes both instance and duration time periods so in the Period Properties dialog box below (invoked by clicking on the ellipses in the Period tab in the Categories pane) we’ve selected only duration periods, or those with a start and end date. We will now use XPath to filter the data. We’ll create a variable $altova:duration that translates the difference in number of days between the start and end dates of the period into the number of months and then selected data where that variable is equal to three (equivalent to a fiscal quarter). We’ve also used XPath to create a dynamic label combining Q3 with the year.
  Because our line chart is visualizing changes in revenue and costs and expenses over time, we have used the Sort function in the Period Properties dialog box above so that the data appear chronologically.
  Although the appearance of the chart (e.g., colors, labels, and visibility of tick marks and axis values) can be controlled with the All Settings button in the Chart Settings section of the XBRL Chart Wizard dialog box, it can also be controlled with XPath via the Dynamic XPath Settings button under Chart Settings (below).
  This feature provides tremendous flexibility not only in managing appearance but in managing the contents of the chart. Among the many things you can do with XPath are controlling output based on conditions and adding a dynamic title that includes the time period reflected as we’ve done here. Once you click the Dynamic XPath Settings button in the XBRL Chart Wizard dialog box (above), the Dynamic XPath Settings dialog box is invoked (below).
  Clicking the ellipses next to the property that you want to edit in the Dynamic XPath Settings dialog box (above) brings up the Edit XPath Expression dialog box (below). Here we’ve used XPath to concatenate a string (“Revenues / Costs and Expenses”) with the first and last years in the period we identified in the Period Properties dialog box earlier.
  The XPath expression entered here will overrule the settings in the Change Appearance and XBRL Chart Wizard dialog boxes – notice in the chart (here rendered in HTML) includes the dynamic title that we built with XPath rather than the title in the XBRL Chart Wizard Dialog Box.
  As we’ve shown here, the XBRL Chart Wizard provides developers and designers with a highly flexible tool for visualizing XBRL data. With XBRL’s place in the international technology sector firmly established, the ability to leverage XBRL data to support strategic decision making is key. There are a number of different types of companies that are discovering the strategic value of XBRL. Our XBRL case study describes how the Maryland Association of CPAs streamlined their tax reporting and benchmarking processes with XBRL. This case study is a great resource for anyone interested in learning how to leverage this data with Altova software tools.
Have you created something really great with the XBRL Chart Wizard? Or developed an interesting project using StyleVision or another of our tools? Please share your story with other Altova users by commenting on this blog post. Think it would make a great case study? Email us at marketing@altova.com – if we choose to use your story you’ll receive a $200 Amazon gift card as well as some free press for you and your organization. We’d love to hear from you!
Leverage Your Financial Data with the XBRL Chart Wizard–Part 1
Extensible Business Reporting Language (XBRL), an XML-based language for financial data, is increasingly being used by both public and private organizations across the globe – in fact it is mandated for some companies in countries including the United Kingdom and the United States. Altova provides comprehensive support for XBRL tagging and XBRL reporting with the MissionKit, a suite of our most popular software. Among the MissionKit tools is StyleVision, a graphical stylesheet designer and report builder, which can be used to support a host of internal reporting and analysis activities for companies that use XBRL. In the next post we’ll focus on StyleVision’s XBRL Chart Wizard, a powerful XBRL visualization tool that can turn your XBRL-tagged financial data into powerful charts and graphs – if a picture is worth 1,000 words then StyleVision is worth its weight in gold. Calling the XBRL Chart Wizard You invoke the XBRL Chart Wizard as you do the XBRL Table Wizard and other StyleVision capabilities. Once you’ve started a design by selecting New – New from XBRL Taxonomy from the File menu and selected a taxonomy and working XBRL file, all concepts are populated to the Schema Tree. From here you simply select a concept from the XBRL taxonomy in the Schema Tree and drag it into the design window. For this example we’ll be using the Carnival Corporation quarterly report for 2009 that they have published with the SEC, but you can apply the same techniques to any XBRL instance document – be it a publicly available filing with the SEC or an internally generated XBRL file. As a first step, we will look at how the revenues are composed by creating a pie chart that shows the revenue breakdown. Here we’ve dragged the Revenues concept (highlighted in the Schema Tree in the left sidebar) into the design window and selected Create XBRL Chart.
  Once you select Create XBRL Chart the XBRL Chart Wizard dialog box will open automatically.
  Once you click the ellipses in the corner of the Concepts tab in the Series pane, the Concept Properties dialog box (below) will open and you can select concepts to appear in the chart. Carnival Corp breaks out revenues for their cruises between Passenger tickets and the Onboard and other. We will select those two concepts, and also the Other category to capture all elements that make up the total revenues.
  Pie Charts Pie charts are useful when you wish to see the relative contribution of individual elements to the whole. Placing Onboard and other, Other Sales Revenue Net, and Passenger Tickets in a pie chart provides us with a visual representation of the relative contributions of each source of income to total revenue. We are now ready to make changes in the XBRL Chart Wizard dialog box so that our pie chart reflects the information we need in a format conducive to strategic decision making. First we must change the chart type under Chart Settings from Bar Chart to Pie Chart 3D via the Change type… button, which brings up the Change Type dialog box (below).
  In pie charts, the concepts that will form the segments of the pie (in this instance the Onboard and other, Other Sales Revenue Net, and Passenger Tickets concepts that we selected above) are placed in the Categories pane and the values in the Series pane. Therefore we will need to move the Concepts tab to the Categories pane and the Period tab to the Series pane. We’d like to segment the revenue data from the XBRL file based on quarter. We do this by dragging the User-Defined Grouping (by Quarter) tab from the Available pane to the Categories pane. We’ll make the necessary changes in this tab in the next step. We will also check the Remove empty categories and Remove empty series boxes so that a value or label will not be generated if no data exists and change the size of the chart to 350 pixels x 350 pixels in the Chart Settings section of the XBRL Chart Wizard dialog box. After we make these changes, the dialog box looks like this:
  Now we are ready to select the data that appears in the chart. First we’ll segment the data by quarter. We invoke the User-defined Grouping Properties dialog box pictured below by clicking the ellipses in the corner of the User-defined Grouping (by quarter) tab in the Categories pane. The grouping feature provides you with maximum flexibility by allowing you to segment data based on variables identified in the taxonomy (e.g., reporting period, geographical area, division). Now we can use XPath in the Group By field to group the data by quarter, filter it based on the group we created (in this example only the second quarters will appear in the chart), and add a dynamic label. We want the chart to reflect all second quarter data for each of the revenue concepts we selected so we toggle Do not filter under Group key filter.
  We can further filter the data by clicking on the ellipses on the Period tab in the Series pane to bring up the Period Properties dialog box. Here we’ve selected only duration periods (i.e., those with a start date and end date – instant periods have a single date reflecting the date that the “snapshot” was taken) and filtered based on year. In this example only data from the second quarter of 2009 will appear in the chart.
  Finally we can fine tune the chart’s appearance by clicking on the All Settings tab under Chart Settings, which brings up the Change Appearance dialog box. Here we’ve opted to show the concept labels, values, and percent of total. We can also select color schema, chart size, font types and sizes for each section of the chart (e.g., chart title, labels, legend), and background colors.
  After making all of these changes we hit OK in the XBRL Chart Wizard dialog box and the pie chart reflecting these changes is created. Please note that after the chart is created you can go back and edit the chart settings.
  As you can see, the biggest source of revenues is Passenger tickets, which produced 75.02% of total revenues for Carnival Corp in the second quarter of 2009. As is the case with all StyleVision designs, output can be rendered in HTML, RTF, PDF, and Word 2007+ formats and an XSLT stylesheet for each format is automatically generated. And this was just one example of what kind of data you can extract from an XBRL filing and visualize in a chart. Next week we’ll look at creating bar charts and line charts from XBRL financial data.
  Have you created something really great with the XBRL Chart Wizard? Or developed an interesting project using StyleVision or another of our tools? Please share your story with other Altova users by commenting on this blog post. Think it would make a great case study? Email us at marketing@altova.com – if we choose to use your story you’ll receive a $200 Amazon gift card as well as some free press for you and your organization. We’d love to hear from you!
Processing the Groupon API – Part 3
Concluding the series in this post, we will apply a stylesheet to transform the XML data created from our mapping of the Groupon API into HTML. Here is an example of the XML output from the data mapping we created last time:
Assign a Stylesheet to Transform XML The Component Settings dialog for the output component of the MapForce mapping allows us to assign a stylesheet created with Altova StyleVision.

 When you click any of these output format buttons, MapForce executes the data mapping exactly as we saw in the previous post. MapForce seamlessly passes the XML output to StyleVision, where it is transformed to the selected format. MapForce then displays the formatted document in the Output window. Here is the MapForce Output window for HTML, based on the StyleVision Power Stylesheet assigned above:
  The MapForce Output menu lets you save the XML data mapping output or the HTML document formatted according to the stylesheet. How to Make a Stylesheet We designed a stylesheet for the Groupon API data mapping using Altova StyleVision, based on the XML Schema for the MapForce output component. The intuitive StyleVision interface and powerful data access and manipulation features make it easy to create attractive documents in HTML, RTF, PDF, and Microsoft Word formats from XML files. The screenshot below shows the StyleVision Design View of the Extreme Groupon stylesheet. The blue numbered circles identify the location of each design feature listed following the image.
  Features of the SPS file
Assigning a stylesheet to the data mapping output component integrates the operations of MapForce and StyleVision, and a new series of buttons appears at the bottom of the MapForce mapping window for HTML, RTF, PDF, and Microsoft Word formats. (You must have both MapForce and StyleVision installed on your computer.)
StyleVision Power Stylesheets can combine multiple .xsd files, existing .css stylesheets, database schemas, XBRL taxonomies, and more to produce richly formatted reports that can even include automatically generated charts in various styles. You can also use StyleVision to define e-forms with data entry fields, drop down menus, radio buttons and other advanced features. Previewing Stylesheet Transformations StyleVision lets you assign a working XML file to preview your output as you design the stylesheet, and the buttons along the bottom of the Design window make it convenient to display the formatted working file as you refine your design. We saved the XML output of the MapForce mapping and assigned it as our working document. When the stylesheet was complete, the HTML Preview in StyleVision was identical to the MapForce HTML Output window shown above. To view the document on a mobile device you can either deploy the HTML as a page on a Web site or email it as an attachment. In addition to the stylesheet itself and formatted versions of the working document, StyleVision lets you save generated XSLT files to transform other XML files using your stylesheet design outside the StyleVision application. Automation Next Time In the future when you want to re-run a data mapping and refresh the HTML document with up to date data, there are two ways to automate the process:
XMLSpy, MapForce, and StyleVision are all available together in the specially priced Altova MissionKit. See for yourself how easy it is to use the MissionKit to convert data from a Web API — download a free 30-day trial!
Editor’s Note: Our original series on mapping data from the Groupon API ran in three parts you can see by clicking the links here: Part 1 of Processing the Groupon API with Altova MapForce describes how to create dynamic input by collecting data from multiple URLs. Processing the Groupon API with MapForce – Part 2 describes how we filtered data from the API and defined the output to extract only the most interesting details. Processing the Groupon API – Part 3 describes formatting the output as a single HTML document optimized for desktop and mobile devices, and reviews ways to automate repeat execution.
Processing the Groupon API with MapForce – Part 2
In Part 1 of this series we described how to connect Altova MapForce to the Groupon API. We queried the API for a list of Groupon divisions, then used the list to create API queries for all the current deals from every division. In this part, we will execute the /deals queries and filter the response for the most interesting data. The list of /deals queries we built previously looks like this: To process all the queries, we can connect the list as a dynamic file input to a new mapping component. When we needed a new component last time, we dropped an API /divisions query into the mapping, and let MapForce create an XML Schema automatically. We could do the same thing here by dropping in an API /deals query as an XML input file. There’s just one small issue — although the Groupon API online documentation clearly describes the queries we can make, it is vague about the information that will be returned. Before we send dozens of queries to the API for all the current deals, we probably want to know a little more about the data that will come back.
 As expected, we got quite a bit of data when we requested all the deals for a single division! A fast way to analyze the structure of this data is to use the XMLSpy DTD / Schema menu option to generate an .xsd file from the xml. Shown below is a reduced view of the entire generated .xsd file based on the response to the /deals query for Dallas:
  We can dig even deeper, following Yogi’s advice like déjà vu all over again. Expanding all the elements to review the XML Schema reveals some curious anomalies. For instance, there are two elements named redemptionLocation with different definitions. The first contains a sequence of child elements:
  And the second is defined as a simple string:
  Going back into the xml data for Dallas and searching for redemptionLocation displays these examples:
  And:
And:  And:
And:  Now this is really interesting, because redemptionLocation = ”online” identifies deals that can be redeemed from anywhere, instead of by a visit to a bricks and mortar location in the division where they are advertised. What if we ran the /deals API queries for all divisions and extracted a list of all the online deals? That would be one extreme Groupon! Only Ask for What You Need The Groupon /deals API query supports an optional parameter called &show= that allows users to limit the data returned. Applying this parameter can save bandwidth and reduce processing time for the data transformation by removing unwanted data from the API response. We can also simplify our final result by including only the most interesting information, including the link to the Groupon web page for each deal. After we remove unwanted elements from the generated Dallas schema, our final version for the summary of online deals looks like this:
  When we add the &show= parameter to our MapForce mapping to request only the elements included in the simplified XML Schema, the queries look like this:
  Now we can drop the revised .xsd file into the mapping and connect the list of API /deals queries as dynamic input. We don’t need to delete the text file we used to collect the list of queries — that might continue to be helpful for future debugging.
  These changes complete the input side of the data mapping. Defining the Data Transformation Output Back in XMLSpy we can make a couple more revisions to the input XML Schema to design a new version for output:
  We discarded the response element since it doesn’t add any value, and eliminated the redemptionLocation element that we don’t intend to include in the output. We also added a date element for a timestamp, because our output file will be a snapshot of data that is constantly changing. After saving this version of the .xsd file in XMLSpy, we can drop it into the MapForce mapping. Shown below is the output side of the mapping with the output component partially connected. The filter at the top reads the redemptionLocation element to select only online deals and the now function inserts the date:
  The last revision we made in the output XML Schema was to change several element types from dateTime, Boolean, and integer to the string data type to allow more descriptive text Here is the complete definition of the mapping with the final connections to the output component:
  Now for the Payoff When we click the Output button MapForce processes the entire mapping from beginning to end using the MapForce Built-in execution engine. Here’s a breakdown of the steps:
Let’s Make a Deal Like Yogi Berra said, you can observe a lot just by looking. Let’s start by running a /deals query in XMLSpy. That will let us examine the response to a query for one division before we pull in a potentially unwieldy volume of data. The XMLSpy File / Open menu includes the same Switch to URL option we used in MapForce in the earlier post. If we enter the /deals API query for a division that covers a large metro area – say Dallas – we are likely to get enough deals instances to extrapolate the characteristics of the entire data set. XMLSpy opens the response to the /deals API query in Text view just as if we opened a local file:
MapForce takes only a few seconds to complete all those steps and generate an output file with a series of deals that look like this: In part 3 of this series we’ll design a stylesheet to automatically transform the XML output of our mapping into html for attractive presentation in a web browser and on mobile devices. See ya at the ballpark, Yogi! XMLSpy and MapForce are available together in the specially priced Altova MissionKit. See for yourself how easy it is to use the MissionKit to convert data from a Web API — download a free 30-day trial!
Editor’s Note: Our original series on mapping data from the Groupon API ran in three parts you can see by clicking the links here: Part 1 of Processing the Groupon API with Altova MapForce describes how to create dynamic input by collecting data from multiple URLs. Processing the Groupon API with MapForce – Part 2 describes how we filtered data from the API and defined the output to extract only the most interesting details. Processing the Groupon API – Part 3 describes formatting the output as a single HTML document optimized for desktop and mobile devices, and reviews ways to automate repeat execution.
The PXF File as the Software Equivalent of Plug and Play – A Database Editing Use Case
A few weeks ago we introduced you to the Portable XML Form (PXF), a file format in which all design elements supporting a StyleVision design including XML Schema and instance documents, SPS design files, XSLT, images, and other external files are embedded. End users simply open the PXF file in Authentic and can immediately start editing XML and database data. In this post we’ll create an electronic form for business users to record donations and enter new donors for a fictitious charity called the Green Planet Fund.
Altova’s new PXF file format is a boon to developers and end users alike –the PXF file can be transported, downloaded, copied, and saved like any other office document, increasing both efficiency and error-free deployments. Developers no longer have to send or install multiple files or create a server application to support a design and business users can distribute critical business information quickly and reliably. This is especially true in distributed organizations where business data needs to be sent around via e-mail between different locations or between field employees and their counterparts in the home office. A PXF that supports electronic forms designed in StyleVision and edited by business users in Authentic makes editing business data a snap. In most cases that business data will be contained directly within the PXF file as an embedded XML document, but it is also possible to connect a PXF file to a database server and store the data directly in the database, as the following use case shows.
For this example we’ll be using StyleVision to create an electronic form on which business users will record donations and enter new donors for the fictitious Green Planet Fund. End users interact with these forms in the Authentic WYSIWYG editor, a sophisticated word processor-style interface that allows end users to capture, view, and update XML and database content. Once you click File, New from DB in StyleVision, the Connection Wizard is invoked. Simply select the database type – you will be prompted to browse for the source. Here we’ve identified the DonorsDatabase from the MARKETING006SQLEXPRESS server. The connection string is automatically saved with the design file and re-established each time a business user accesses the form in Authentic. The database is updated with the information that the business user enters in the Authentic form.
  Once you establish a connection, you can select tables, data views and even SQL SELECT statements in the Insert Database Objects dialog box.
  For this example we’ve added a SQL SELECT statement (below) that concatenates donor title, first name, and last name and calculates the total amount contributed by each donor. Once you click Add SELECT Statement the SQL SELECT statement becomes available to the StyleVision design, as seen above.
  Please note that we used Altova DatabaseSpy, a multi-database query, design, and database comparison tool, to build our SQL statement. Although you can export data from the SQL Editor in DatabaseSpy into a range of formats, for this example we simply copied the SELECT statement from DatabaseSpy into the window in the SQL SELECT dialog box in StyleVision. StyleVision generates a temporary XML Schema based on the structure of the database and displays it in the Schema Window. Note that both the Contributions and Donors tables as well as our SQL SELECT statement appear in the Schema Tree.
  During this transformation StyleVision creates internal XML files – a non-editable one for previews and as the source of the generated XML data file as well as an editable XML file that will write modifications back to the database. Now that we’ve established and saved the database connection string we’re ready to design the electronic form that Green Planet Fund will use to add new donors and log contributions. For this example we’ve created two simple tables in StyleVision – one for recording contributions and another for looking up and adding donors. (Please note that our example is for illustrative purposes only and we’ve shown only a small sample of the fields that we would typically include in a real-world application. The functionality too is far less sophisticated than it would be in an actual project.) We’ve done the following to our design: · Created a design fragment with a table for entering new donors and a table of registered donors that is populated dynamically · Added a checkbox that when toggled will show the registered donors table and the data entry table from the design fragment · Edited the Authentic properties of the registered donors table to retrieve all records · Edited the Authentic properties of the data entry table to retrieve only one record to make it easier to enter data · Used XPath to concatenate each donor’s title, first, and last names for the table of registered donors, using the normalize-space function to remove all white spaces · Used Value Formatting (below) to format the contribution date – this also allows the end user to edit the date via a calendar interface in Authentic
  Note the design fragment ‘DonorList’ is enclosed within the DB tags and is represented as a single element. The design fragment itself appears at the bottom of the design.
  Clicking the tabs next to the Design tab will render the report in different formats. Here we’ve presented the Authentic view.
  Notice that the design is still in standard SPS format (greenplanetdonorsII.sps) – we are now ready to save it as a PXF so that it can be emailed to the client and deployed immediately upon receipt. Once you select File – Save As from the top menu, you can choose whether to save the design as a SPS or PXF.
  When you Save as PXF File you are prompted to select the files to embed in the PXF file. All files supporting the StyleVision design are automatically made available in the dialog box.
  Here we’ve checked each of the design elements as well as the XSLT files. This will allow end users to generate output from the StyleVision-designed form in each of these formats directly from Authentic. Please note that you also have the option to include additional files. Although this design does not require other files, this feature makes transporting and deploying projects that require multiple files significantly easier. Now you can send the PXF file that you have just created to the client. All project files as well as the database connection string are embedded in the PXF so that once the end user opens it in Authentic he can immediately start viewing, editing, and entering data. To create a new record in Authentic, place the cursor in one of the fields in the contributions table on the form and click the Append row button on the tool bar. (Alternatively you can select Authentic – Append Row from the top menu.)
  Now the business user can enter contributions (new data is in bold) …
  …and new donors.
  Note that in the SQL Server database the Donor ID is an auto-generated field. Once the end user clicks File – Save from the top menu, the new information is posted to the database, the database generates an ID number, and the new information populates the other tables in the form. (As reflected above, data is populated in real time.) Edits and additions are immediately written to the database. The SQL Server database view below shows that Edward and Julie Jay, whom we have just added to the Authentic form, have been assigned a donor id of 18.
  Although we did not include it here, the form can be designed to generate an error message when the user attempts to save a new donor without at least one first and last name. This can be accomplished using XPath in the additional validation property of the Authentic properties or by creating a constraint in the SQL Server database. This use case was designed to show how easy it is to create and deploy interactive forms. Electronic forms designed in StyleVision have always been a great way to update both XML and database content – the PXF file simply makes it easier to transport and deploy them.
Have you used the PXF form yet? Or created a really cool database project using StyleVision or any of Altova’s other tools? Please share your story with other Altova users by commenting on this blog post. Think it would make a great case study? Email us at marketing@altova.com – if we use your story you’ll receive a $200 Amazon gift card. We’d love to hear from you!
Processing the Groupon API with Altova MapForce
We often think of a data integration project as a translation from one singular data input file to some other data set, but Altova MapForce lets you greatly expand the concept of an input file. For instance, the MergeMultipleFiles.mfd example installed with MapForce illustrates how you can use a filename with wildcard characters to merge multiple input files into a single output. A MapForce mapping input doesn’t even need to be a physical file – it can be a URL that returns predictable structured data, like the APIs for popular Web sites like Groupon and many others.
 When we click the Open button MapForce offers to generate the schema:
  When we click Yes, the File / Save dialog opens. I saved the schema as divisions.xsd, and the mapping with the new XML Schema inserted looks like this:
  And the Properties dialog for the XML Schema component automatically contains the API /divisions URL as the Input XML File:
  Check the Work We want to filter the Groupon divisions data to build a list of id names to use for deal queries for each locality. But before we go any further, now might be a good time to apply the text file trick from the Quick Solution for Complicated Functions blog post to look at the id values. When we insert the text file and connect the divisions and id schema elements, the mapping looks like this:
  We connected the division element to Rows in the text file in order to generate a new row in the text file for each unique division, so that Field1 in each row will hold the id. Clicking the Output button now generates this result:
  All we need to do is apply the concat string function to build the list of /deal URLs for all division IDs. The next step in the mapping looks like this:
  Rolling the cursor over the constant connected to value1 of the concat function displays its full definition:
  When we click the Output button to execute the mapping, the Output file now looks like this:
  As a further review, we can open the generated XML Schema in XMLSpy and display it in graphical Schema View:
  So far we have:
In this blog post we’ll describe how to use Altova tools to retrieve, filter, analyze, and present data available from a Web-based API, using Groupon as an example. If you want to follow along yourself, you will first need to visit http://www.groupon.com/pages/api to request your personal Groupon API client key. The Problem: All Deals Are Local The Groupon Web site and email subscriptions are great for finding deals in your local neighborhood, but what if you’re looking for a deal to use on an upcoming vacation, or for a gift for friends or family across the country? Sure, you could enter each location manually at the Groupon Web page, but that’s so last century. Let’s use the Altova MissionKit to automate things. The Groupon API offers two URL queries that return data in .json or .xml formats: the first returns a list of all Groupon localities (called divisions), and the second returns current deals information for one named division. If we want to see all the deals for more than one division, we need to resolve multiple URLs and aggregate the data into a single result. Yes, MapForce can do that! First We Need a Schema The Groupon API documentation describes the elements that will be returned by our requests, but doesn’t provide an XML Schema. That’s okay, we can use MapForce to generate one. All we have to do is open a new mapping design and choose Insert XML Schema/File, then click the Switch to URL button. Now we can enter the URL to retrieve the Groupon divisions list:
In the next post in this series we will process the list of deal queries as the input for a new mapping component and filter the output for some interesting information. Find out for yourself how easy it is to apply MapForce to convert data from a Web API! Download a free 30-day trial of MapForce.
Editor’s Note: Our original series on mapping data from the Groupon API ran in three parts you can see by clicking the links here: Part 1 of Processing the Groupon API with Altova MapForce describes how to create dynamic input by collecting data from multiple URLs. Processing the Groupon API with MapForce – Part 2 describes how we filtered data from the API and defined the output to extract only the most interesting details. Processing the Groupon API – Part 3 describes formatting the output as a single HTML document optimized for desktop and mobile devices, and reviews ways to automate repeat execution.
UML Class Diagrams in Altova UModel
Altova products have long been recognized for their rich, intuitive user interface. One example is the UModel diagram window, which includes multiple display options for class diagrams to facilitate ease of use and improve information clarity in objected-oriented models. Class diagram style for projects that generate .NET (C# and Visual Basic) application code UModel 2011 Release 3 includes a new option for displaying class diagrams for .NET programmers. If your project will generate source code in .NET programming languages (C# or Visual Basic), your classes may contain .NET properties that can be called from outside like attributes, but are implemented internally as methods. To better organize .NET classes, UModel offers an option to display .NET properties and methods in separate operations compartments inside classes. This view is an optional setting in the Styles helper window for class diagram display and editing. Choosing to display separate .NET properties compartments or a single traditional UML operations compartment has no influence on code generated from the class.

View or Hide Class Properties and Operations Developers can collapse Properties and Operations compartments using convenient grab handle tools along the right edge. They can also customize the display of classes to show or hide individual class properties and operations. The right-click context menu offers a Visible Elements dialog for any selected class.
This feature lets users simplify the diagram to focus on the properties and operations relevant to the task at hand. Hidden items are indicated by ellipses. Clicking on an ellipsis re-opens the Visible elements dialog. Options for Interface Notation UModel 2011 supports alternate diagram styles for interfaces between classes. By default, new interfaces are created in class diagram style with arrowhead styles and notations to indicate the interface creator and interface users. In the class diagram below, the developer wants to concentrate on class relationships and interfaces, so all the properties and operations compartments are collapsed.
  Interfaces have a special Toggle Notation quick-editing button to switch from the class diagram style to the UML ball and socket interface notation.
 Visibility Icons vs. Mathematical Operators The UModel visibility icons, along with the visibility pull-down menus in the drawing window and properties menu, have been praised because they avoid confusion with common mathematical operators that can also appear in definitions of properties and operations. But users who prefer the traditional view can choose UML Style in the Project Styles helper window.
  All the style settings selected to display class diagrams on screen are also applied when rendering project documentation in Word, RTF, or .html formats Find out for yourself how you can improve development of your object-oriented application by customizing the display of class diagrams with Altova UModel – download a free 30-day trial today!
Service Pack 1 Available
Just a quick note to let customers of Altova Software Version 2011 Release 3 know that Service Pack 1 (v2011r3 SP1) is now available for all Altova products. In addition to bug fixes, SP1 includes important enhancements:
Please note that v2011r3 SP1 is a new product version (not a patch). All customers with a license for Altova Software v2011r3, as well as any customer with an active Support and Maintenance Package for their Altova product(s), can simply download and install this update.
Visit the Altova Team at FOSE
Use Built-In XPath Functions
In developing one of the Altova Online Training courses, I sorted a list of books by the authors. I realized that my author field was a string of the author’s full name, so the books were sorted by the first letter of the string, or the author’s first name. It did not fit into the course to fix the sorting, but you can easily extract the last name from a string and use it for the sorting key using XPath functions. If you then use the books’ titles for a secondary sort key, you run into an issue with titles that start with “A”, “An”, or “The”. I want to use the title for the secondary sort key, but ignore a leading definite or indefinite article.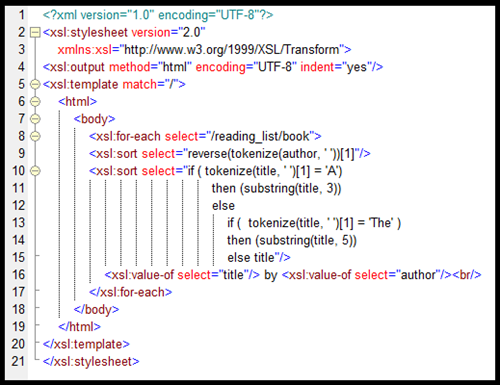 Let’s take a look at how we created this XSLT code.
 An XSLT to create a list of the books would look like this:
  This will generate the following output:
  The books are output in the order they appear in the original data file. If we add xsl:sort to the xsl:for-each loop, we can arrange our output in other ways.
  This will generate a sorted list, but not sorted properly.
  Sorting author as a string, results in “Jules Verne” appearing ahead of “Mark Twain”. Also, “A Connecticut Yankee in King Arthur’s Court” appears ahead of “Adventures of Huckleberry Finn”. We want to ignore the indefinite article, “A”, so that “Adventures of Huckleberry Finn” appears ahead of “A Connecticut Yankee in King Arthur’s Court”. We can use XPath expressions to extract the sorting keys we want.
  Let’s examine the code before we look at the output. We replace “author” with “reverse(tokenize(author, ‘ ‘))[1]”. Tokenize breaks the author string into tokens using a single white space as the break point. So, “Jules Verne” is tokenized into “Jules” and “Verne”. Reverse reverses the order of the tokens to “Verne” and “Jules”. The one in square brackets chooses the first item in the list, “Verne”. This is the value that is used in for the xsl:sort function to arrange the books. This is not the perfect solution, but it works in our case. The title looks convoluted, but the logic is straightforward. The “tokenize(title,’ ‘)[1]” expression extracts the first word of the title. So, the first if test is “Is the first word of the title the word “A”? “. If it is, then we return the substring of the title that starts with its third letter, thus eliminating “A” and the space. If the first word of the title is not “A”, then we need to test it again to see if the first word of the title is “The”. If it is, we use the substring of the title starting with its fifth character, thus eliminating “The” and a space. If we fail both tests, then we just pass the title along as the sorting key. We could add another test to our code to see if the first word is “An”, but it is not needed for this data set. Executing this last XSLT, we get the following output.
  “Mark Twain” is now ahead of “Jules Verne”. “Adventures of Huckleberry Finn” appears ahead of “The Celebrated Jumping Frog of Calaveras County” and “A Connecticut Yankee in King Arthur’s Court”. The flaw in our approach to the author string is that we want “Jules Verne” to be treated as “Verne, Jules” for the sort, so that if we had a book by “Jimmy Verne”, the sort would treat them as different authors. Our code does not. Using “concat(reverse(tokenize(author, ‘ ‘))[1], reverse(tokenize(author, ‘ ‘))[2])” would sort “Jules Verne” and “Jimmy Verne” correctly, but this solution only will work with 2 word names. If an author had a suffix (“Martin Luther King, Jr.”) or multiple words (“George Herbert Walker Bush”), the code would fail. There are many exceptions to the general rules on alphabetizing names, and the code to allow for all variants goes far beyond the scope of this article. What we wanted to show was the ability to manipulate XML data on the fly using XPath expressions. We do not always have complete control on the format of our data sources, but using the power of XPath expressions, we can transform the data into the format that we need. A copy of the files used in these examples is available here.
This article was written using XMLSpy as the platform, but the same XPath expressions can be used inside MapForce or StyleVision to achieve similar results. We can start with a simple XML book list. We have 4 books with author and title nodes.
The Maryland Association of Certified Public Accountants (MACPA) transforms data to XBRL in-house
What is XBRL and how can it help your organization? Members of the Maryland Association of CPAs (MACPA) found out how using the interactive XBRL (Extensible Business Reporting Language) format can help not only larger, public companies, but also smaller, non-profit organizations like themselves. MACPA invested in the Altova MissionKit tool suite to support their XBRL project. Using our XMLSpy XML editor; MapForce, our graphical data mapping, conversion, and integration tool; and the StyleVision visual stylesheet and report design tool, MACPA was able develop a comprehensive system that employs XBRL data for a variety of reporting functions, both internal and external.
 MapForce also came in handy for mapping the Global Ledger (GL) Taxonomy to the extended GAAP taxonomy.
  As a result, MACPA has increased its working knowledge of XBRL, automated previously burdensome data collection and transformation tasks, and have gained more insight into their financial data. To read more about how MACPA utilized the Altova MissionKit to convert all their financial data to XBRL and create a model for public and private business of any size to leverage the powers of XBRL, the latest case study from Altova is a must read! Do you have a story to tell about your use of Altova tools? If so, we want to hear from you. Case studies generate great publicity. Check out recent press coverage from the MACPA case study. Plus, if we choose to use your story you will receive a $200 Amazon gift card!
For example, MACPA used the generated instance document from MapForce to populate their financial Key Performance Indicator (KPI) system, significantly reducing the amount of time and effort required to prepare the KPI documentation. XMLSpy was used to extend the US-GAAP taxonomy to accommodate entries specific to MACPA.
A Quick Solution for Complicated Functions
Some data conversions require multiple steps to satisfy today’s complex data communication requirements. Altova MapForce 2011 lets you graphically combine a wide variety of mathematical, logical, string, and other specialized functions to build complicated "data equations" to get the results you need. If you’re working on a big, complicated mapping, if you’re using an unfamiliar function for the first time, or when your function creates an intermediate result that needs further processing, it is helpful to test your work each step of the way as you build. You can use a simple text file as a temporary target to see the output of your function under construction. Let’s say we want to add a date and time stamp to an existing mapping of an output file to record the time the data was generated. We can easily experiment with the MapForce now function in a new mapping that simply connects now to a text file. Clicking the Output button at the bottom of the mapping window shows us the immediate result:
 Okay, that works, but maybe the consumer of the output file would like to see a more elegantly formatted version. We can work with various datetime and string functions and build a complicated function until our mapping looks like this:
  Or we could simply use the format-dateTime conversion function with a string constant to define the format:
  As we work, we can press the Output button at any time, until we are satisfied with a result that looks like this:
  If you don’t work with dateTime data types every day, it’s hard to write a format string on your first try that generates the desired result! After several attempts, variations, and consultations with MapForce Help, here’s the format we developed and stored in the string constant connected to the format input of the format-dateTime conversion function:
  So far we used a text file that was defined as a basic CSV file with only a single field, but you can open the file Properties dialog and add fields or create a more customized output file.
  One advantage of using a text file as the output target is there is no type checking of the function result, so the text file target lets you examine and verify the output of any function. In the screenshot below we created a mathematical function and added a second field to the text file target to map the result.
  Now the output is a single-row, comma separated result like this:
  If our ultimate target is going to be a database field or an XML element with an integer data type, then we can immediately see this mathematical function doesn’t produce the expected datatype. When you have perfected your function in the test mapping, you can simply select, copy, and paste it directly into your larger mapping. You can then connect the output of the function to your ultimate target. In the screen shot below our format dateTime function is mapped to an element in an XML schema that is defined as a string.
  If this is a function you are likely to want again in the future, you can convert it to a User-Defined Function and save it in your library for convenient reuse.
  You can even use a text file as a temporary target to build and test a complicated function right inside your larger mapping. In that case, your mapping includes multiple possible outputs. The eyeball button at the top right of each output file selects which output file is displayed in the Output window.
  When you select the text file as the Output preview, the MapForce execution engine does not process the larger mapping, only the function connected to the text file. This can be a huge time-saver when you just want to examine the function result and your larger mapping processes a large volume of data, or if you don’t want to risk inserting invalid data into a database, and in many other situations. Find out for yourself how easy it is to apply MapForce to your own data mapping projects! Download a free 30-day trial of MapForce.
Directory Sync Tools: Move over little dog, a new DiffDog is moving in
Altova DiffDog was originally launched in 2005 as a diff/merge tool with XML-aware functionality to help users identify differences between XML files. It even identifies files that are XML-equivalent but appear different in a text comparison because of spacing, line-ending, or attribute order variations. DiffDog has continually improved over time with many new features including:
DiffDog 2011 Release 3 adds a new simplified directory sync feature to its robust folder diff/merge functionality. The Synchronize Directories dialog now includes a button at the top to select a complete directory sync in a single step. The Fully Synchronize feature produces an exact copy of the source directory, even if the target has newer versions of some files, and deletes files from the target that don’t exist on the source, making this choice a quick tool to backup complex directories containing many files and sub-folders. DiffDog provides a summary of all actions to be taken before any files are copied or deleted:
  If you want to prevent a file being overwritten or deleted from the target directory, you can click Cancel, and then use the Manual Override feature to ignore or reverse the copy direction for any file pair.
  Pretty good trick for an app that’s older than 42 in dog years*, isn’t it? Find out for yourself how DiffDog can faithfully synchronize your directories – download a fully-functional, free 30-day trial! * Popular myth suggests that one calendar year for a software developer is equivalent to 7 years in the life of a dog. For a more complete discussion of canine lifespan, see the Wikipedia article titled Aging in Dogs.
It’s Here – the Industry’s First Truly Portable XML Form
Hopefully by now you’ve downloaded the 2011r3 versions of the Altova product line released last week. We’ve introduced a bunch of new features and functionalities that put even more power into the hands of IT professionals. (Note: If you haven’t already done so, you can download the latest versions of all of the tools in the Altova product suite from our Web site.) One of the features we’re most excited about is the new Portable XML Form (PXF) file for StyleVision and Authentic. The PXF is a file into which all elements required to support a StyleVision design including XML Schemas, database connections, images, etc. can be embedded. Imagine the possibilities! In this post we’ll take an in-depth look at the PXF file format as well as some use cases.
 Once the design is complete, creating a PXF file is as easy as selecting Save As and toggling the Save as PXF file radio button.
  When prompted to select files to embed in the PXF, remember to check the output formats that end users will be able to publish content in.
  With all design elements now embedded in the PXF file, you can distribute the form easily and efficiently.
When you create a design in StyleVision and then save it as a PXF file, all design elements including XML Schema and instance documents, SPS design files, XSLT, images, and other external files are embedded in the PXF. The PXF file can be transported, downloaded, copied, and saved like any other data file, meaning that developers no longer have to send or install multiple files to support a design. This is especially useful for integrating Authentic electronic forms into your projects – and consequently great news for business users. Authentic electronic forms created in StyleVision allow business users to edit databases and XML files without wrangling with database and XML syntax. The PXF file makes developing – and using – these forms even easier. Take, for example, the bane of many a business traveler’s existence – the expense report. Fortunately for the IT professional using Altova tools the expense report is a snap – a developer can create an eye-catching report that meets the business needs of the client by taking advantage of StyleVision’s many design capabilities.
The PXF is a boon to business users as well as developers. Depending on how you deploy the expense report, business users can access it via Authentic Desktop or in their browser with the Authentic Browser Plug-in. As he would with any Authentic form, an end user simply opens the PXF file in Authentic Desktop and can immediately begin editing or adding data. The associated XML file or database is updated automatically to reflect the changes. End users accessing an Authentic form via the Authentic Browser Plug-in likewise update XML and database data by entering and editing information in the form. The value of the PXF for end users is the same as for the developer – portability. Because the PXF file contains all of the files necessary to support the Authentic form, including the instance document, the business user can enter his expense data, resave the file, and then send the PXF to the accounting department. He can even email the PXF directly from the application.
  The PXF file also provides business users with the ability to publish content in multiple output formats. In our example the developer clicked HTML, RTF, PDF, and Word 2007+ in the Configure Portable XML Form (PXF) dialog box. A business user can instantly create an output document in each of these formats by clicking one of the output buttons on the menu bar.
  Here we’ve clicked the PDF button, generating a document that a business traveler can mail to the corporate office, keep for his records, etc.
  Although the portability afforded by the PXF significantly increases the value of electronic forms by simplifying the process of getting critical business data into XML, Authentic forms in general are an easy sell to business users. In addition to comprehensive editing capabilities, Authentic enhances the business value of electronic forms through features that include real-time validation of input data, industry standard XML templates, project management support, and dynamic layout based on user input. In addition to all of the functionality and editing capabilities Authentic offers, the application can compete on price – the Authentic Community Edition is free. We hope that you are as intrigued by the possibilities offered by PXF as we are. By providing developers an easy way to integrate electronic forms into their projects and a simple (and free) way for business users to distribute and publish information, PXF could radically transform the process of creating and editing XML and database content. This is a truly exciting prospect. For those of you not yet using our tools, this is a perfect time to give them a try. Click here to download free, fully functional trial versions of our software. They’re good for 30 days!
Have you used the PXF form yet? How did you use it? Please share your story with other Altova users by commenting on this blog post. Think it would make a great case study? Email us at marketing@altova.com. We’d love to hear from you!
Release 3 of Altova Software Version 2011
What is PXF?
PXF is a new file format that – finally – makes editable XML forms truly portable. PXF files are configured in StyleVision 2011r3, where a developer creates a design that generates an interactive electronic form that can then be accessed and edited by non-technical business users in Altova Authentic (or in the Authentic View in XMLSpy). When the StyleVision design is saved as a PXF, the XML Schema(s), XML instance(s), electronic form, etc., are all embedded in the PXF file. The PXF can even optionally include the XSLT files autogenerated by StyleVision that allow the business user to publish his data in HTML, Word, RTF, and/or PDF – with a single click. After a PXF file has been created, it can be transported, downloaded, copied, and saved like any other data file. Why PXF? The benefit of the PXF file format is that all the components required for editing XML content – and for the generation of output reports from Authentic – can be conveniently distributed in a single file. And, since Authentic Community Edition is a free product, PXF deployment couldn’t be more affordable.
  There are countless usage scenarios for the PXF file, but one example is to allow a business user to easily get important data into a valid XML document and send it back to the requester or to another department, such as HR or Accounting. The user receives a PXF file by email and opens it in Authentic. The XML file will be displayed in Authentic using the embedded StyleVision eForm design, and can be edited using the word processor-like Authentic interface with access to advanced interactive options, context sensitive entry-helpers, business logic validation, and more. The File | Save command saves changes to the PXF, i.e., the embedded XML is modified and saved. The File | Send by E-mail command makes it easy to send the updated PXF on to another user with a single click. In addition, when XSLT files associated with the SPS are included in the PXF, Authentic toolbar buttons let the user render his data in multiple formats for publishing or further communication. PXF takes the headache out of getting critical business data into XML – without sacrificing any of the benefits that XML brings to data integration and extensibility.
XML Digital Signatures
To address the growing need for security around XML transmissions, v2011r3 includes support for assigning and verifying XML digital signatures through the implementation of W3C XML Signature technology across multiple MissionKit tools. An XML Signature enables digital authentication for XML transactions by checking the integrity (whether the data has changed since it was signed) and the authenticity of origin (the identity of the signer). In contrast to other digital signature methods, XML Signature is uniquely suited to working with XML data because it includes measures for canonicalization, which involves signing the important data while ignoring inconsequential changes such as whitespace and line endings. In XMLSpy 2011r3, it’s easy to add an enveloped, enveloping, or detached signature to your XML-based files using either certificate e or password-based authentication. You can also verify signature(s) on files received. If the file changed at all since it was signed, verification will fail.
  Other MissionKit tools with XML digital signature support include:
HIPAA Data Mapping
In addition to new features for Excel® data mapping and other enhancements, MapForce 2011r3 now includes native support for mapping HIPAA 5010 data. Health care enterprises that send or receive HIPAA information will be able to apply MapForce 2011 Release 3 to meet a number of requirements. Users of legacy healthcare IT systems that do not store data files internally in a format compliant with the latest HIPAA standard can use MapForce 2011r3 to map incoming HIPAA 5010 transactions to the enterprise internal format or database. Or, a MapForce mapping can be designed to generate HIPAA-compliant transactions for output from existing non-compliant data. If the enterprise wants to translate legacy healthcare data for internal storage in HIPAA 5010 format, MapForce 2011 Release 3 is the tool for that one-time transformation too! Native HIPAA support adds to current support for HL7 (Health Level 7) and other EDI standards. Check out all the features added in the latest Altova release, and stay tuned for more details here on the blog.
StyleVision Supports XBRL for Financial Reporting Part I – Creating GAAP-Compliant Reports and StyleSheets with a Single Click
Did you know that StyleVision is also an XBRL rendering and reporting tool that will allow you to create GAAP-compliant financial reports with the click of a button ?
 To create a stylesheet or report, drag the appropriate presentation link into the design window (for this example we have selected 124000 – Statement – Statement of Income (Including Gross Margin)). You will be prompted to create an XBRL table, XBRL chart, or XBRL template.
  Selecting Create an XBRL Table will invoke the XBRL Table Wizard.
  Note that under Options we have US-GAAP mode checked. If you check the US-GAAP mode box StyleVision will generate a table with all of the financial data in the presentation link selected. (You can select which period you would like represented under the Options tab as well). Output in HTML, RTF, PDF, and Word 2007+ formats, plus corresponding stylesheets, are automatically generated once you click OK. Although there are a number of formatting options in the Table Wizard, once the table is generated you can make additional changes (e.g., background color, font, text, table borders, etc.). In the example below we highlighted the <xbrli:instant> element and used Value Formatting to change how the time periods are represented. In the XBRL instance document, the time period appears in YYYYY-MM-DD – YYYY-MM-DD format. We have changed it to [Number of] Months Ending YYYY-MM-DD.
  Notice the Styles window in the screenshot below – we’ve also changed the table header’s background color to navy and the text color to white.
  Sorting, grouping (via XPath), and filtering (via XPath) options can also be edited after the table is generated by the XBRL Table Wizard. Simply right click in the Period or current-group bar above the table header and select the appropriate function. The Group by … dialog box appears below.
  The GAAP-compliant table rendered in HTML appears below.
  The HTML output above reflects the formatting options we selected in the XBRL Chart Wizard:
In this post we’ll show you how …
Altova’s native support for XBRL is great news for IT professionals serving a range of industries given the US Securities and Exchange Commission’s (SEC) formal embrace of XBRL as a financial reporting language. In fact, virtually all public companies using GAAP accounting will be required to submit financial data for fiscal periods ending on or after June 15, 2011 to the SEC in XBRL, an XML-based language. IT professionals will be called upon not only to facilitate the exchange of data but to render XBRL data in a manner intelligible to business users. StyleVision can help. With a number of built-in capabilities that allow you to create customized GAAP-compliant stylesheets and reports for XBRL data with only a few clicks, StyleVision can make you look like a technical – and accounting – whiz. When you create a new design from an XBRL taxonomy, StyleVision creates a schema tree that reflects the presentation linkbase, an XML file that includes sets of related concepts grouped under presentation links (e.g., in the example below, 006091- Disclosure – Segment Revenue and Operating Income is a presentation link). Typically the presentation linkbase will appear in the schema tree as discrete financial statements, addendums, disclosures, and the like (this will depend on the contents of the linkbase – and keep in mind that although standard not every XBRL taxonomy will have a linkbase). Individual root elements are also available for reporting/processing and appear below the presentation links.
One last thing to note is that in our example we have selected the entire presentation link 124000 – Statement – Statement of Income (Including Gross Margin) and all data in that presentation link is populated to the table. However if you expand the presentation link in the schema tree you can select individual line items or those grouped together from a presentation link and create a mini-table. This is just an overview of how you can use StyleVision’s built-in GAAP-compliant functionality to render XBRL data in some simple ways – the possibilities for presenting this data are virtually limitless. In future posts we’ll discuss using the XBRL Table Wizard to combine multiple line items from different presentation links for highly customized data presentation, creating powerful charts with the XBRL Chart Wizard, and other ways to help organizations leverage their XBRL data (we’ll even provide an example of how XBRL financial data can be used with other data sources to create an annual report).
Have you used Altova tools to create XBRL solutions for your clients? Please share your story with other Altova users by commenting on this blog post. Think it would make a great case study? Email us at marketing@altova.com. We’d love to hear from you!
Switch Statement vs. Look-up Table in MapForce
One of the great things about working with software developers is you not only get to create new things that never existed before, you also get to see how other peoples’ minds work when they discover alternate solutions to any design challenge. We received a comment from a software developer on our recent post titled Expandable If-Else Works like a Switch Statement in MapForce regarding one of the examples we used. The reader suggests that our second example illustrated a problem that would be more elegantly solved in Altova MapForce with Value-Map than by our Expanded If-Else statement. Here was the original example that received the month as a string of characters and needed to generate the corresponding number: A Value-Map in MapForce is an alternate solution that functions as a look-up table, whereas an Expanded If-Else acts like a switch statement. Here is how our mapping would look with a Value-Map in place of the Expanded If-Else:
  Yep, that’s it. Rather than copying, pasting, and modifying sets of elements the way we built our original Expanded If-Else, a Value-Map lets us easily create the entire look-up table in its Properties dialog:
  We accept the commenter’s point — Value-Map definitely works better for the problem we chose because it’s much quicker and easier to create! The table from the Value-Map properties is also more concise and easier to interpret in MapForce-generated mapping documentation than our original Expanded If-Else structure. Of course you can’t always replace an Expanded If-Else statement with a Value-Map. Data entering the Value-Map must equal a single value in the input table to generate a specific output, whereas Expanded If-Else lets you set up a series of conditions with different logical tests. Sometimes the exact nature of a data conversion project makes it a judgment call to use a switch element vs. a look-up table. Let’s say your project receives input as a number that represents a wavelength of the electromagnetic spectrum and you want to handle ultraviolet, visible colors, and infrared energy individually. In that case we could use an Expanded If-Else to test for ranges of input values. The Expanded If-Else section of the mapping might look like this:
  If the input is an integer, you could also create a solution using Value-Map, but you would need to build a very long look-up table. And then what happens later if the project requirements change and the input becomes a decimal number, or you need to filter each visible color separately by name? Essentially Altova MapForce is a really cool graphical representation of a complete software language toolbox that insulates you from detailed programming language syntax, with a rich collection of components you can assemble creatively to solve your own data mapping, conversion, and integration challenges. Find out for yourself how easy it is to apply MapForce to your own data mapping projects. Download a free 30-day trial of MapForce.
Visit Altova at Tech*Ed 2011
Diff / Merge for Databases
You may already be familiar with the diff/merge functionality Altova DiffDog brings to working with source code, XML, and Word files – but did you know you can also connect to, compare, and merge database data and structures? DiffDog supports all major relational databases and includes a Connection Wizard that lets you quickly connect to one or more. As shown in the screenshot below, natively supported databases include Microsoft® Access™, SQL Server®, Oracle®, MySQL®, IBM® DB2®, Sybase®, and PostgreSQL. When you compare different database types, DiffDog even resolves datatype naming inconsistencies. This means you can compare the customers table in your SQL Server database with a backup copy, for example, or you can compare the contents of any tables or your entire database schema between IBM DB2 9 and Oracle 11g implementations. Note: Altova DatabaseSpy includes the same diff/merge capabilities described here.
Database Content Differencing
It’s easy to compare database content in DiffDog. Simply connect to the database(s) required, and select the tables to be compared. DiffDog displays the compared components side-by-side, and tables and columns are mapped automatically based on configurable options. You can also change or create mapping connections manually when needed. After you click the Start Comparison button, DiffDog displays results with informative icons. In the simple example below, the content in the database tables is not equal. Next, you can launch a detailed comparison of the unequal table to see the content of the compared columns side-by-side, with differences highlighted. Tool bar buttons let you merge changes in either direction.
Database Schema Differencing
It’s just as easy to compare database schemas in DiffDog to, for example, identify and merge differences between a development and production version of the same database. All database items (e.g., data types, constraints, keys, etc.) are displayed in the comparison components so that you are able to compare the structure of the tables within the database schema. You can merge the two schemas or selected items using Left and Right buttons on the tool bar, or access more merging options via the right-click menu. Database schema changes aren’t merged instantly – DiffDog always creates a SQL change script compatible with your target database type that you can review before committing the changes to the database.
  You can also save the SQL script to a file or open it for further editing in DatabaseSpy. Learn more about the powerful database diff/merge functionality in DiffDog. You can also download a free trial to give it a test drive.
Solution to the Software Testing with State Machines Challenge
Last month in our blog on Software Testing for State Machines with Altova UModel we discovered unexpected behavior in our model of an air conditioning system and challenged readers to improve the design. This post describes one possible solution. When we ran the Tester application for our model, we saw that the Power switch did not turn the system off when it was in the Standby state. In the state machine diagram in our original model, the only route into Standby from Operating mode is via the Standby button, and the only way out of the Standby state is to press the Standby button again, as seen in the detail below. We can create an alternate exit to power off the system from the Standby state simply by drawing a new transition line from Standby to the Off state, and assigning powerButton() as the event that triggers the transition. UModel makes assigning the trigger easy by providing a pop-up window listing events that are already defined in the model.
  Our completed revision to the model with the new transition from Standby to Off looks like this:
  After regenerating the Java code and compiling the new version, we can run the Tester application again. The Debug output message window shows that the system entered Standby in Event 3. Event 4, activation of the Power button, now sets the state to Off.
  Find out for yourself how you can enhance the logic of your own state machine diagrams with Altova UModel – download a free 30-day trial today!
Expandable If-Else Works like a Switch Statement in MapForce
In response to several user requests, the if-else component in MapForce has been enhanced in MapForce 2011 Release 2 to accommodate any number of variables. This feature, which is equivalent to a switch statement in many programming languages, enables you to easily control the flow of data in a mapping project by matching a value to a selected criterion. For example, the screenshot below shows the if-then component used in combination with other components to analyze temperature data and produce the following results:
Using the StyleVision Combo Box to Support Data Visibility Requirements
Altova is always on the lookout for ways to help software developers and architects meet the challenges presented by the increasingly complex collection, storage and retrieval requirements of end users. In fact, we recently enhanced the functionality of the combo box in StyleVision to provide developers with additional flexibility around collecting and populating data. There are three ways to define the items in a combo box and their associated XML values – automatically based on a valid schema, manually with a list of populated values and dynamically with an XPath expression. In the latter two scenarios, the value that appears to the end user can be different than the value that will populate the file or database. This feature is particularly useful in cases where the “meaning” of the underlying data isn’t obvious or intelligible to an end user (e.g., a seven digit part number). The values in a combo box can be automatically populated with enumerations from a valid schema. In this case the value that appears to the end user is identical to the XML value that will populate the file or database. The functionality is perfect in cases where the elements in the schema provide an accurate reflection of the data content as understood by multiple stakeholders (e.g., end user selects Four to indicate group assignment, which populates the file with the XML value Four). Developers can also populate the combo box manually, defining both the value that appears to the end user and the XML value that will populate the file or database. These values do not need to be the same. So, for example, an end user can select Acme Dishwasher, Stainless while a complex product code populates the file or database used to generate the purchase order. This is an especially useful for collecting standardized data using organization or department-specific taxonomies and supporting multi-lingual applications.
  Finally, combo boxes can be populated dynamically via XPath expression. Use the same XPath expression to define the values that the end user sees as well as their associated XML values or use different XPath expressions to identify discrete values. If you use different XPath expressions the values the end user sees and their XML values are automatically mapped to one another. In the example below, the end user is prompted to select the group to which he is currently assigned (one, two, three or four). However the group number (not the name) will populate the database. Please note that the values the end user sees could be sorted in alphabetical (or numerical) order if the Sort Values in Authentic box were to be checked.
  The XPath expressions above produce the output below – the end user selects “Two” but a numeric value is saved to the XML document.
  The combo box – particularly one that supports the differentiation of values visible to the end user and those that actually populate the database or file – is an invaluable resource in the design of electronic forms. StyleVision automatically generates the stylesheet for an electronic form along with those for HTML, PDF, Word 20007+ and RTF from your template. The Authentic eForm provides an interface for end users to enter and edit XML or database data and is viewable in Authentic View, Altova’s free graphical XML document editor. Have you used enhanced combo box functionality to solve a data entry or population issue? Share it with our active community of StyleVision users by posting to our Facebook wall, commenting here on our blog or joining a discussion in our User Forum on our Website!
Software Testing for State Machines
Many varieties of software testing have gained prominence as developers search for ways to improve quality and meet project deadlines – code review, unit testing, regression testing, beta testing, test-driven development, and more. Regardless of a project’s goals or the source code language employed, it’s well accepted that the earlier a defect is found, the easier, cheaper, and more rapidly it can be fixed. Code generation from UML state machine diagrams, a new feature introduced in Altova UModel 2011 Release 2, can be used to validate conceptual logic very early in project development. Real-world design in a state machine diagram An example included with UModel provides a simple and realistic state machine diagram with a small test application you can run to see for yourself how easily it can be to test the logic of a design. The state machine diagram in the AirCondition.ump project in the UModel 2011 examples folder describes the operation of a typical heating and air conditioning system. The system includes a power button shown on the left side in the transition from the Off state, a modeSelect function that selects heating or cooling, a speedSelect function for the fan, and a standby button that puts the system in the standby mode shown on the right. The example project folder includes all the code generated for the diagram by UModel in Java, C#, and Visual Basic. To try out the Java version, all we have to do is use the command javac STMTester.java to compile the code and java STMTester to run it. The tester application displays a simulated control panel with information windows about the heating and air conditioning unit. The operating buttons appear along the top, the current state is described in the first window, and output messages generated by changes in the system appear in the second window.
  As shown above, the system initializes in the Off state, the mode is set to heater, and the fan is off. Before you operate the system, you might want to resize the control panel and state machine diagram to follow the actions of the tester application in the diagram itself, as shown in the reduced size image below.
  Operating the state machine When we click the powerButton, the Current state window is updated and a detailed description of the operations that occurred are listed as Event 1 in the Debug output messages window.
  If it’s a hot day, we might want to change the mode to Cooling and increase the fan speed, which we can do by clicking the modeSelect and speedSelect buttons. The Current state window updates with each click, and Event 2 and Event 3 are added to the output messages window.
  Now we can see how the tester application lets us fully exercise the logic of our state machine diagram by clicking every possible sequence of button selections to see if they produce the expected results. For instance if we put the unit in Standby mode (Event 4 below), then press speedSelect, we see in the output messages for Event 5 that no state change occurs in the substate named RegionSpeed. Compare Event 5 to Event 3 in the output messages window as shown below.
  Now that the system is in Standby mode and we don’t need any heating or cooling, let’s save energy by pressing the Power button to turn it off.
  Wait a second – it looks like nothing happened. No transition took place in Event 6, and the Current state in the top window is still Standby! Looking back at the state machine diagram, we can see the only way out of Standby mode is to press the Standby button again. Is that really the behavior an average user would expect, that the Power button would not turn off the system from Standby mode?
  Just imagine how expensive this issue could be to fix if it was first identified much later in product development when the prototype was being tested by a regulatory agency! Here’s a challenge we’ll throw out on the table for our readers: how would you design another more direct route from the Standby state to the Off state? Testing your own state machines You can use the UModel state machine code generation example projects as templates to create test applications for your own designs. You will want to take advantage of the UModel feature that automatically creates operations in a class as you add operation names to transitions in your state machine.
  Also, the UModel Help system includes detailed information about code generation from state machine diagrams and also uses the AirCondition.ump project file as an example. Find out for yourself how you can improve project development by testing the logic of your own state machine diagrams with Altova UModel – download a free 30-day trial today!
Harness the Power of Chained Transformations in MapForce
Altova MapForce includes the ability to define chained transformations. Chained transformations let you create complex mappings where the output of one mapping becomes the input to another. In other words, two or more components can be directly connected to a final target component.
Read more…
Hot off the Press!
The industry is abuzz with the latest news announcing our release of the MissionKit Version 2011 Release 2. The release is loaded with new features for chart and report creation, enhanced data mapping capabilities, new XML Schema editing functionality, support for the latest version of BPMN, and a really cool new feature for comparing and merging Microsoft® Word documents. Dr Dobb’s and SQL Server magazine are just a few of the industry publications and blogs that covered the launch.
 Read what the industry is buzzing about and then download a free 30-day trial of the MissionKit and check out for yourself all the powerful new features now available in our suite of XML, database, and UML tools!
Advanced Presentation and Formatting in StyleVision
The StyleVision stylesheet and report design tool has added a plethora of advanced functionality over the past several releases. In this post we’ll explore some of the advanced presentation and formatting capabilities that make this tool so powerful. Data visualization (e.g., charts and graphs) and other graphical elements are de rigueur these days. Whether it’s showing change over time via a simple bar graph, highlighting performance with an image from the art department, presenting market data with a candlestick chart or developing a gauge for dashboard reporting, organizations today demand the ability to include sophisticated graphics on all sorts of output – including Web sites. Altova StyleVision 2011r2 can help you meet these demands with advanced presentation and formatting capabilities. You can use StyleVision to generate graphical representations of XML, database, and XBRL data for output to eForms, PDF, HTML, RTF, and Word 2007+. Advanced formatting capabilities will enable you to create impressive charts, graphs and other data views that resonate with audiences. In addition to 2D and 3D bar and pie charts, you can create line, area, candlestick, and gauge charts for use on Web sites or printed materials. Overlay reports provide you with the ability to juxtapose two data sets such as opening, high, low, and closing share prices (candlestick chart) with daily share volume (bar chart) as pictured here. Comprehensive style attributes including colors, background images, legends, and even dynamic XPath settings provide you with complete control over how XML, database, and XBRL data are presented. Among pie chart attributes StyleVision users can select from, for example, are start angle, drop shadow, tilt (for 3D), color scheme (including user defined), and visibility of values, percentages, labels and legends.
  Adding background color and images is easy with drop down boxes – to achieve the yellow vertical gradient pictured in the overlay chart below simply go to All Settings under Appearance in the Chart Configuration dialog box, select Background Color in the Plot section of the General tab and select vertical gradient and the yellow color swatch from the drop down boxes.
 StyleVision even offers users the ability to design templates so that output can be modified dynamically based on end user input. Below is an eForm that presents information in English and German depending on which button is toggled – conditional statements associated with a variable declared at the $XML template control this. Please note that the formatting in the Date field changes as well.
 Keep in mind that any form that you would like to reproduce in StyleVision can be imported as a “blueprint,” a configurable image that serves as a template. This allows the designer to place text, input fields, and other design elements directly on the template and makes it easy to build an eForm identical to the original. With advanced presentation and formatting for charts and graphs Altova significantly extends the capabilities of StyleVision’s already powerful report builder – your designs are limited only by your imagination.
  We’d love to hear how you are using these or other capabilities in developing your own projects. Please share your stories by posting to our Facebook wall or commenting here on our blog! If you haven’t tried StyleVision before, now is the time. Download a free, fully functional, 30-day trial from the Altova Web site now.
Now Generate Barcodes in StyleVision
We’re listening.Altova clients have been asking us when they would be able to include barcodes in their StyleVision templates and now they can! StyleVision 2011r2 users can generate barcodes with a single click and insert them into an SPS template for use in eForms, as well as HTML, RTF, PDF, and Word 2007+ output. This brings even more advanced functionality to stylesheet and report design for XML, database, and XBRL data in this unique tool. Simply click on Insert Barcode from the Insert menu, define the type from the Barcode4J library and add the value used to generate the pattern (“text”).
 StyleVision gives users complete control over the presentation and appearance of barcodes – other properties that can be controlled via the dialog box include size, alignment, colors and borders.
  You can even use an XPath expression to assign a barcode to a property value.Altova is really excited about providing our clients with the ability to include barcodes in StyleVision-generated output. From larger companies supporting enterprise systems to smaller organizations looking to facilitate electronic data exchange without the use of middleware, StyleVision supports the goals of a broad range of users.Please note that a Java Runtime Environment 1.4 or later (32-bit or 64-bit as appropriate) must be installed to support this feature.
Creating XML from Relational Databases
Sometimes following an example someone else created is a good way to get a quick start on a project. The downside is you might miss a better, more efficient solution. In our recent post on XML in the Cloud, we used DatabaseSpy to connect to a local MySQL database and to the Amazon Relational Database Service in the cloud. We used the Concat( ) function in a SQL SELECT statement to create XML formatted output from non-XML data as shown below. Our SELECT statement was based on an example in the MySQL documentation on XML support. Let’s take a little deeper look at the problem this statement tries to address. You can copy a DatabaseSpy Results table like the one displayed above and paste it into an editing window in XMLSpy, but the Results table alone does not create a well-formed XML document. To be well formed according to the W3C definition, an XML document must contain a root element. All other elements and logical structures must nest within the root. You can also think of the root element as a wrapper around the entire XML content, the same way the element <city></city> encloses each line in our original results. A Better Way to Create XML from Relational Data We don’t need to manually edit the results to add a root element, nor do we need to adapt our already-complicated SQL query to add the root. DatabaseSpy lets us easily export well-formed XML documents from database tables that contain ordinary data like our cities table. In the DatabaseSpy Export dialog we can choose XML Structure as the output format, click the cities table to select it from the database hierarchy, and choose XMLSpy as the destination. The Preview section at the bottom of the Export dialog shows a view into the table contents.
  When we click the Export button, DatabaseSpy formats the relational data with XML element names derived from the column names of the table and sends the resulting output directly to XMLSpy. The screenshot below shows a portion of the file in XMLSpy. The Message window at the bottom verifies the file is well formed.
  Note that DatabaseSpy supplied the root element <Import name = “cities”> and added comments to describe the datatypes of the database table columns. And, we did not have to construct a SQL statement with a cumbersome Concat( ) function. We began this post to address the simple requirement for a root element to complete the output of the Concat ( ) function we described earlier. When real-world projects require converting from relational databases to XML, the requirements are likely to be much more complex. Altova XMLSpy connects directly to all popular databases to work with XML technologies and relational data. XMLSpy lets you easily create an XML Schema from a database structure, or create a database schema from an XML Schema. XMLSpy also includes advanced editors and debuggers for XQuery and XPath for XML stored directly in databases, along with specialized support for XML features in Microsoft SQL Server, IBM DB2, and Oracle databases. As more industries adopt and evolve XML-based standards for information interchange, a common need is to convert data stored in legacy databases to XML. Altova MapForce connects to databases and allows you to map and transform relational data to be compatible with one or more XML Schemas. You can use your mapping to perform a one-time data conversion, you can save and re-open your mapping to perform another conversion later, or you can instruct MapForce to generate royalty-free source code from your mapping to include in your own project when repeated conversions are required. If you’d like to see for yourself how well Altova tools can generate well-formatted XML from relational databases, download a free trial of the Altova MissionKit.
New XML Schema Editing Tools in XMLSpy
Let’s take a look at some of the new features for working with XML Schemas in the latest release of XMLSpy.
Sorting in Schema View
When you’re working in the graphical XML Schema editor, you can now sort some or all of the schema components alphabetically with a single click. This is a huge time saver when you need to organize large schemas that have evolved over time and for understanding new schemas that come across your desk. Simply click the A-Z button in the Schema Overview window and select the sort options you prefer. Your components are instantly sorted in the graphical view…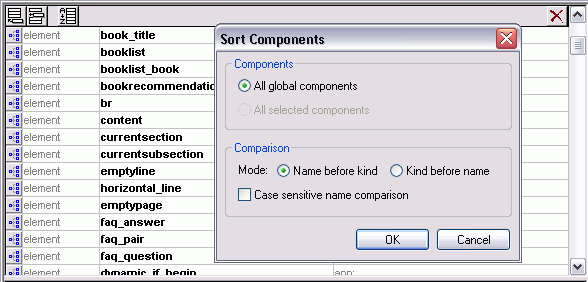 …and when you click over to Text View, the schema code itself is reordered and organized.
Schema Refactoring
Another new feature that’s invaluable when working with complex schemas or ones inherited from other developers is schema refactoring support. Taking advantage of XMLSpy’s powerful Find in Schemas functionality, you can quickly locate all the instances of a global element or type across a schema – and all imported and included schemas – and then rename that component in each place it occurs. This makes schema refactoring easy while ensuring the validity of all impacted schemas.
Intelligent Support for Changing Types
You may also find the need to change the type of an element or a base type, which previously meant reconfiguring all the facets associated with that component. This new feature gives you the option to preserve any facets or attributes that are compatible with the new type.
Customizable XML Schema Documentation
Another option schema developers have requested quite often is the ability to customize the comprehensive XML Schema documentation generated by XMLSpy. This is now possible via integration with StyleVision. The StyleVision stylesheet design tool provides countless advanced options for customizing the documentation templates, from adding your company’s logo and branding to changing the appearance and organization of the documentation completely. StyleVision integration also gives you the option to generate documentation in PDF in addition to the HTML, Word, and RTF output options available for the fixed documentation in XMLSpy. Here’s an an example of XML Schema documentation we customized for the fictional Nanonull corporation: XMLSpy 2011r2 also ships with several useful documentation templates that can be used as is or customized further in StyleVision:
To use a custom schema documentation template, you must have XMLSpy and StyleVision installed. If you are a MissionKit customer, you already have both tools and can take advantage of this feature and countless other options for working with XML Schema, from stylesheet and report design, to data mapping, and more. If you aren’t currently a StyleVision customer, grab a free trial from our Web site. The XBRL and WSDL documentation generated by XMLSpy may also be customized using StyleVision. As always, we rely on your input and feature requests when planning each release – please let us know what you think of these new features and what you’d like to see in the next product version by leaving a comment here on the blog.
Using Charts to Effectively Communicate Data
Altova first added support for charts and reporting the Altova MissionKit with the launch of Version 2011 last September. The v2011 reporting functionality includes options for line charts, 2D and 3D bar charts, 2D and 3D pie charts, round gauge and bar gauge charts. Here are a few examples:
Advanced chart features in v2011r2
Version 2011 Release 2 of the Altova MissionKit, introduced on February 16, adds an exciting group of enhancements to the chart and reporting features in XMLSpy, StyleVision, and DatabaseSpy. The chart design options and user interface work the same way in all three applications, so MissionKit users can work intuitively and productively as they move from processing XML data in XMLSpy, to preparing charts for a business intelligence report with StyleVision, and even when they create graphical displays directly from SQL query results in DatabaseSpy. The wide range of new customizable charting features introduced in version 2011 release 2 includes:
Now you can create attractive and informative charts to represent a wide variety of data sets without exporting data to a dedicated charting application. Charts created using the Altova MissionKit are not limited to any specific presentation technology – for instance you can use StyleVision to include charts in HTML, Microsoft Word, RTF, or PDF documents, or you can save charts created in DatabaseSpy in a variety of image formats at the custom resolution you specify. In this post we will show some examples of the new charts and features available in all three MissionKit reporting and charting applications – XMLSpy, StyleVision, and DatabaseSpy.
Stacked bar charts
Stacked bar charts are a variation on bar chart presentation and are especially useful when multiple ranges of data need to be illustrated. Stacked bar charts are also useful to more clearly illustrate data in a smaller area. The image below shows a stacked bar chart to illustrate the performance of a sales team by region over two years Note that the combined height of each stack in the Stacked Bar Chart represents the total sales over the two-year period for each Territory, since the sales for Last Year are added above the Year To Date numbers. Stacked bar charts complement regular bar charts and 3-D bar charts to offer users the greatest flexibility in illustrating SQL query results. If the user prefers horizontal bars, a checkbox labeled Draw X and Y exchanged in the Change Appearance tab selects that orientation.
 This orientation option is also available for other 2-D bar charts, line charts, area charts, and candlestick charts.
Area charts
Area charts are similar to line charts, with shading applied to make a more graphically appealing display. The area chart below shows a record of temperature and humidity changes by hour over the course of one day. Creative application of color can emphasize the point! To successfully build an area chart, the analyst must consider the values in each data category. As the area chart is constructed, each category forms an opaque layer on top of the layers for data retrieved previously. In the case illustrated above, Temperature was always a larger number than Humidity, so a SQL query was constructed in DatabaseSpy to retrieve the Temperature value before Humidity to prevent Temperature from acting like a curtain to hide the Humidity data. However, if the data columns appear in a sequence with values in increasing order, the last layer would overlap and hide all the preceding layers. In that case, the chart tab heading titled Select Data lets the user add and delete columns from the results to re-sequence the data correctly. The Select Data column also lets the user edit the names assigned to each column on the X-axis label.
  As alternative solution, the Transparency option in the Change Appearance tab lets the user adjust color levels to allow hidden layers to show through.
Stacked area charts
As implied by their name, Stacked Area charts layer the columns of a data set to illustrate the overall sum of a data series. Stacked Area charts also eliminate the potential overlapping data problem that can occur with regular area charts. The chart below shows a table of air passenger revenue miles traveled by month, with individual regions for domestic and international travel. The Stacked Area chart creates a graphical representation of the total of Domestic and International miles, even though the total miles value was not part of the provided data. This is apparent at the top of the January entry, where the International region intersects the Y axis just below 600 (the original data showed 392 million Domestic miles and 181 million International miles, for a total of 573). A strategic data analyst will always consider the nature of the data to be reported when choosing any particular chart type. For instance in the weather example we used above, adding temperature and humidity values in a stacked bar chart would not be logical!
Candlestick charts
Candlestick charts were originally developed by a wealthy Japanese businessman who began trading at the local rice exchange around the year 1750. He kept records of the local market psychology, learning to boost his profits by carefully monitoring prices and not rushing into trades. Today, charts are used to represent financial data such as stock prices over a period of time. Every day the market is open, each stock has four relevant data points that can be rendered in a candlestick chart: the price at market opening, the price when the market closed, the high price during the day, and the low price during the day. Investors and financial analysts like to view these indicators to gauge the stock’s performance over a period of time. In the candlestick chart below, each solid bar represents the range between the opening and closing price and the thin vertical line through each bar shows the extent of the high and low prices for the day. In this version of the chart, following common convention, the color of each bar signals whether the stock was up or down for the day. If the bar is green, the stock was up for the day– it opened at the price indicated by the bottom of the bar and closed at the price indicated by the top. If the stock was down for the day, the bar is red and the symbolism is reversed – the stock opened at the price indicated at the top of the bar and closed at the price shown by the bottom. Numerous options are available to set line and fill colors, the Y-axis range and values, and more. Because they were intended to be printed in black and white, the original candlestick charts used empty bars to indicate the price increased and solid bars to indicate price decreases. The Altova MissionKit offers this option:
  Another candlestick chart variation omits the opening price and simply illustrates the range by a vertical line and the closing price by a horizontal line. This option is automatically supported when a data set only includes the high, low, and closing prices.
Chart overlays
The Overlays feature lets you combine multiple charts in a single image. Each overlay chart has unique settings and can even be generated from a separate data file. The image below shows a candlestick chart of a stock’s daily prices with the daily sales volume in a bar chart overlay.
Support for background images & color gradients
The ability to specify background color gradients and background images gives you even more flexibility for creating customized, eye-catching charts. Overlaying one chart on another lets you visualize multiple data sets with different Y-axes and types. The Change Appearance dialog lets users select a background image, as in the Winter Games chart above, or apply a background color gradient, as in the Summer 2010 chart below.
 If you’d like to see for yourself how easy it is to use Altova tools to create attractive charts from XML and database data, download a free trial of the Altova MissionKit.
Release 2 of Altova Software Version 2011
Organizing BPMN Diagrams with Layers
Altova UModel® 2011 allows users to organize diagrams into subgroups and place each group in an individual layer. Layers can be selectively hidden or exposed, providing a convenient way to decompose a BPMN diagram that describes a complex business process involving multiple departments or enterprises. This layers feature can be used with all diagram types supported by UModel and can clarify any complicated diagram, such as a use case with multiple actors or sequence diagram. You could even add a comments layer to collect feedback on a model from other project stakeholders. Here is a view of the UModel Layers helper window with a Default layer and Comments layer. When you circulate the model for review, the Design layer could be locked to allow changes only to the Comments layer. It’s easy to assign elements to a layer by using the right-click context menu.
  Later on we could choose to hide the Comments layer from view, while retaining the layer contents in the diagram to preserve a historical record of the reviewer comments.
  When diagramming a complex business process, we can create individual layers for each participant so each layer then provides a simplified view into a portion of the overall process. In this application, we would name layers by department or enterprise. Here is the UModel Layers helper window for an order processing diagram indicating the Sales Fulfillment layer is visible and the Finance layer is hidden:
  Here is the order processing diagram showing only the Sales Fulfillment layer:
  To depict the entire process, we can simply make all layers visible.
  Here is the same diagram with both layers visible:
  Find out for yourself how the UModel 2011 layers feature can enhance your BPMN diagrams – download a free trial today!
What Do Industry Authors Have to Say About Altova?
Authors of various industry reference books ranging from SOA and Web services to XML continue to use and recommended Altova tools. The latest update to the Cold Fusion book series – “ColdFusion 9 Developer Tutorial” is an update to John Farrar’s “ColdFusion 8 Developer Tutorial”. In this latest update, Farrar uses the Altova MissionKit, our suite of XML, database, and UML tools to do all his XML work for the book. According to Farrar, “I have a suite of tools from Altova and find they do what I want. I can create XPath, XML Schemas, and more from their tools and don’t ever feel the need to look for a new tool.” Farrar, a ColdFusion expert, teaches the basics of ColdFusion programming, application architecture, and object reuse. He then shows off a range of topics including AJAX library integration, RESTful Web Services, PDF creation and manipulation, and dynamically generated presentation files. So whether you need an overview of XML technologies, the latest information on working with ColdFusion, or want to delve into Web services, you’ll want to check out the Altova Reference Books page on our Web site.
XML in the Cloud
Working with Altova Tools and the Amazon Relational Database Service (Amazon RDS)
More and more enterprises are discovering the advantages of implementing database applications in the cloud:
In this blog post we demonstrate how to connect to the Amazon Relational Database Service (Amazon RDS) and build a small database using Altova DatabaseSpy. Since the database Connection Wizard is consistent across the Altova MissionKit, you can connect the same way using XMLSpy, MapForce, or StyleVision. If you would like to follow the steps described below for yourself, you will need to sign up for an Amazon Web Services (AWS) account at: http://aws.amazon.com/rds/ You can also download a fully-functional free trial of the Altova MissionKit or any individual Altova application at: https://www.altova.com/download-trial/
Build a Local Prototype
The Amazon RDS is based on MySQL, so we will build a small local database in the MySQL Community Edition, then migrate to the Amazon RDS and test our database in the cloud. Although MySQL does not support XML as a data type for database columns, MySQL 5.1 and 6.0 do support some operations for XML data stored as text. For this exercise we will adapt and extend some of the MySQL XML examples at the MySQL reference resources listed here: http://dev.mysql.com/doc/refman/5.1/en/xml-functions.html http://dev.mysql.com/tech-resources/articles/xml-in-mysql5.1-6.0.html http://dev.mysql.com/tech-resources/articles/mysql-5.1-xml.html First, we launched DatabaseSpy and connected to our local MySQL Community Edition. We created a new data source named LocalPrototype, and created a new database schema that we named XMLtest. The DatabaseSpy Online Browser and Properties windows are shown here: Next, we created two tables called books and cities and inserted data by following the examples in the MySQL documentation. Here is a DatabaseSpy Design View of our tables:
  We can run select queries and display the contents of our tables in stacked results windows:
  Note that the doc column of the books table contains XML data, although it was defined as varchar(150). MySQL supports two functions for working with XML in text fields, ExtractValue() and UpdateXML() that can operate on individual elements via XPath expressions. Below is a simple ExtractValue() query to return only the author initials from every row in the books table:
  function") The UpdateXML() function can be used to modify the contents of individual XML elements using a SQL expression. In the screen shot below, the query on line 1 updates the every row of our books table, and the query on line 2 returns the new values:
The UpdateXML() function can be used to modify the contents of individual XML elements using a SQL expression. In the screen shot below, the query on line 1 updates the every row of our books table, and the query on line 2 returns the new values:  function") We can also use the Concat( ) function to add XML elements to non-XML data such as the cities table, as shown below:
We can also use the Concat( ) function to add XML elements to non-XML data such as the cities table, as shown below:  function") So far, our XML queries have operated on all rows of each table. To facilitate queries for a single row, it’s handy to add a column top the table to hold a unique row index. We can make a copy of our books table and add a column called id to hold the row index. The id column also makes a convenient foreign key to reference an individual XML document in our table from a row in another table. For instance, you might define one table to contain names of job candidates, with a foreign key to reference the XML-formatted resume for each candidate, stored in a separate table. You can use the SQL Editor in DatabaseSpy to generate a CREATE statement for the existing books table and edit it directly, or you can use the DatabaseSpy Design Editor to build the table graphically. (For more information, see the DatabaseSpy section of the Altova Web site.) Since we are planning to run the same queries later in the Amazon RDS, we combined a SQL CREATE statement and SQL INSERT statements into one script for the books2 table. The screen shot below shows part of the script for books2:
So far, our XML queries have operated on all rows of each table. To facilitate queries for a single row, it’s handy to add a column top the table to hold a unique row index. We can make a copy of our books table and add a column called id to hold the row index. The id column also makes a convenient foreign key to reference an individual XML document in our table from a row in another table. For instance, you might define one table to contain names of job candidates, with a foreign key to reference the XML-formatted resume for each candidate, stored in a separate table. You can use the SQL Editor in DatabaseSpy to generate a CREATE statement for the existing books table and edit it directly, or you can use the DatabaseSpy Design Editor to build the table graphically. (For more information, see the DatabaseSpy section of the Altova Web site.) Since we are planning to run the same queries later in the Amazon RDS, we combined a SQL CREATE statement and SQL INSERT statements into one script for the books2 table. The screen shot below shows part of the script for books2:  We can run a query of the books2 table that shows the unique id column for each row:
  Now we can enhance our UpdateXML() and ExtractValue() queries to act on an individual row:
 This gives us a good baseline set of examples to take to the cloud and test in an Amazon RDS.
Connect DatabaseSpy to the Amazon RDS Cloud
After you follow the instructions at the AWS Management Console to create a database instance on Amazon RDS, the Connection Wizard makes it easy to get started with DatabaseSpy. Simply choose the MySQL option as shown here: The first time you connect, you will need to create a new DSN. After the first time, you will be able to select the DSN from a list by choosing the “Use an existing Data Source Name” option. You can even use the original DSN when you go back to connect from XMLSpy, MapForce, or StyleVision.
  In the connector dialog, fill in the following information:
Migrate the Local Project to the Cloud
We can open each of our original table creation scripts and run them in the cloud database by re-assigning the execution target in the Properties window: The gray Execution Target bar near the top of the SQL Editor window identifies the cloud Amazon RDS database as the query target:
  After similarly creating the books and books2 tables, we can run each of the SQL queries in the cloud database. ExtractValue() function for all rows example:
  function") Concat() query to create XML output from non-XML data in a table:
Concat() query to create XML output from non-XML data in a table:  function to add XML elements to data from a non-XML table") UpdateXML() example for a single row in a table.
UpdateXML() example for a single row in a table.  function in the Amazon RDS cloud") ExtractValue() for a single row:
ExtractValue() for a single row: 
Conclusion
In every test we performed, Amazon RDS behaved exactly like the local MySQL community edition. This behavior it much more efficient for developers to build and test new cloud database applications, or enhancements to existing applications, without incurring the cost of cloud resources for development iterations. We also verified the operation of MySQL XML functions for XML data stored in text columns in the cloud databases. Our XML data was very limited – the text column in our books table was limited to 150 characters. However, MySQL lets you store much larger XML documents in a single column. Every table has a maximum row size of 65,535 bytes. Even if your table uses an index column, this means a varchar column for one XML entry could be over 64k bytes. If you need to store even larger XML documents, MySQL offers MediumText and LongText data types, similar to BLOBs. MediumText can hold over 16 million single-byte characters and LongText can hold up to 4 GB. Although not illustrated in this blog post, we have successfully tested ExtractValue() and UpdateXML() functions with MediumText and LongText data types. When you need to store XML data files that large, writing XPath expressions to resolve individual elements can become a development challenge. The XPath Analyzer included with XMLSpy is an invaluable tool that facilitates the testing and debugging of XPath 1.0 and 2.0 expressions. As you type an XPath expression into the analyzer, XMLSpy evaluates it and returns the resulting node set in real time. This can save hours of debugging time spent trying to understand and track down XPath problems. In future blog posts we’ll explore other ways XMLSpy, MapForce, DiffDog, and DatabaseSpy can help developers accelerate creation of cloud application with Amazon RDS. We look forward to seeing you back soon! If you’d like to see for yourself how well Altova tools work with Amazon RDS, download a free trial of the Altova MissionKit.
v2011 Service Pack 1 Available
Service Pack 1 of Altova’s Version 2011 product line is now available for download on our Web site. SP1 includes helpful bug fixes and other enhancements and is a free update for all v2011 license holders, as well as any customer with a valid Support and Maintenance Package. Update to SP1 here, and if you haven’t upgraded to v2011 yet, you can catch up on all the new features here.
New StyleVision Training
We are excited to announce the latest updates to our StyleVision online training course, which will help you easily come up to speed on the new reporting and chart creation functionality added in Version 2011, as well as how to create a StyleVision design (.SPS) based on an existing XSLT stylesheet. The final chapter in the course covers scripting, another advanced feature added in v2011. Access this chapter to learn how the scripting and toolbar editor helps you add flexibility and interactivity to the Authentic eForms you design in StyleVision. After an overview of the scripting capabilities, you’ll practice inserting macros, adding custom toolbar buttons and event handlers, and adding forms to your design.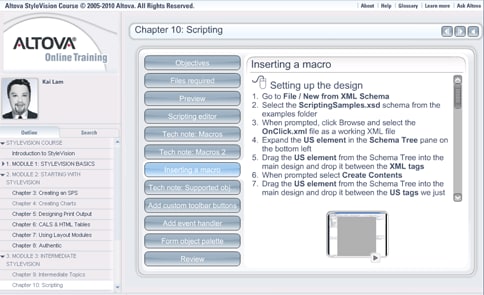 Like all Altova Online Training courses, the StyleVision modules are available on demand and are completely free. If you’re not a StyleVision or MissionKit customer, you can download a fully functional free trial before starting the training. We rely on your feedback and suggestions to update our online training classes and deliver the content you need most for your day-to-day work. Please let us know what you think of the new StyleVision chapters!
Altova XBRL Resources… just in time for XBRL US
With the XBRL US conference just around the corner, it’s high time to brush up on your knowledge. Fortunately, the Altova Web site has everything you need to learn the intricacies of XBRL vernacular, XBRL taxonomy structure, how XBRL relates to XML, XBRL reporting, and more. Altova XBRL Resources
So, check out these resources, download a free 30-day trial of the MissionKit, grab a cup of coffee, and start exploring XBRL today… and don’t forget to stop by our booth next week at XBRL US in Philly!
Introducing XMLSpy 2011 Chinese Language Edition
We are thrilled to announce that with the release of Version 2011, XMLSpy is now available in a Chinese language edition. The new fully localized Chinese edition of the XMLSpy XML editor provides the same powerful functionality found in the English, German, and Japanese versions for editing, transforming, and debugging XML-related technologies. With the release of Version 2011 XMLSpy also adds ground-breaking new support for creating eye-catching charts based on XML data, making it the first and only XML editor on the market to support chart creation. XMLSpy 2011 also delivers several new customer-requested features, including a new schema flattener, extended SOAP validation capabilities, and enhanced functionality for creating schemas. For our current XMLSpy 2011 customers you can unlock any language version using your existing key code. If you’re not an XMLSpy user download a free trial of XMLSpy 2011 to begin using all of the powerful new functionality available in Version 2011. Our decision to bring the localizations services in-house demonstrates our commitment to the Chinese market, and allows us to pass that cost savings on to you, our customers. The Chinese language version of Altova XMLSpy 2011 is currently available in Professional and Enterprise Editions and is available for purchase now from the Altova Online Shop or through your preferred reseller. XMLSpy 2011中文版本推出 我们很激动地宣布2011版本的发布,XMLSpy现在已有中文版可用,新的完全本地化的中文版XMLSpy XML编辑器如今可以提供英语,德语和日语多语种的编辑,转换和调试XML相关的技术,随着2011年的版本,我们还增加了突破性的基于XML数据创建醒目图表的支持,使之成为商场上第一个和唯一一个支持图表创建的XML编辑器,除此以外,我们还添加了多个客户要求的功能,这些功能包括新模式拼合,扩展的SOAP验证和为创建模式增进的功能。
  XMLSpy 2011当前的用户可以使用现有的键码解锁全部语言的版本,如果您还不是我们的用户,您可以下载免费试用版本,开始尝试2011版的强大新功能。 我们的本地化决定证明了我们致力于对中国市场的决心,使我们有机会帮助用户来节约成本,价格从136欧元或15232人民币起,标准,专业和企业版都具备中文版本,您可以通过Altova网店或其他首选经销商购买。
Visit Altova at DevConnections
StyleVision® & Multi-channel Publishing (yup, we've got that covered too)
Ah, StyleVision… it really is so many different things packed into one powerful application. Stylesheet designer, report builder, eForms designer, and multi-channel publisher, with additional supporting features like charting, Authentic® scripting, and XBRL reporting – it sometimes seems like it does everything short of Vulcanian mind-melds (coming in SD 7411.4). But, for the here and now, let’s focus on multi-channel publishing. Multi-channel publishing is the ability to use a single source of information to provide enterprise content that can be formatted for delivery to different channels like Web, intranet, and traditional print. This methodology can be easily integrated into existing publishing technologies and workflows to maintain overall production value without disrupting the flow of day to day business processes. StyleVision even expands on its multi-channel publishing support with the ability to base publishing templates on multiple disparate data formats including XML, DTD, XBRL, and database source(s). This means that your templates can integrate data from multiple XML sources, or even combine data from an XML Schema and a relational database. In fact, you can even create designs to publish XML documents stored inside relational database columns (currently supported for IBM DB2 and SQL Server only). Multiple Output Formats The StyleVision design interface lets you visually create templates for multi-channel output in HTML, RTF, PDF, Word 2007+, and Authentic® eForms. Using drag-and-drop and advanced entry helper windows, you can easily create an attractive and functional template design for distribution to virtually any modern publishing medium.
StyleVision autogenerates standards-conformant XSLT 1.0/2.0 and XSL:FO stylesheets based on your template design to instantaneously publish your source content into the target output format of your choice. Simply click on the relevant output tab on the design pane to render your data at any time. You can even view or save the generated transformation code.
Building Business Reports To create a multi-channel publishing template in StyleVision, simply open an existing XML Schema, XML instance, DTD, XBRL taxonomy, or database, and the content model will appear in the Schema Tree entry helper. You can even connect to multiple XML and database schemas to incorporate data from multiple sources – such as an XML file and a database – in your design. When you select an element or attribute that you wish to see in your report and drag it from the Schema Tree window onto the design pane, StyleVision prompts you to specify how you would like the new node to be handled (for example, as a new paragraph, image, table, etc.). This information will be rendered dynamically based on the data in your source(s). You can also insert static content such as header text, images, hyperlinks, and so on. StyleVision also offers an alternative design paradigm for those more accustomed to working with common desktop publishing applications. For more information, see the Electronic Forms Design page. The StyleVision interface provides advanced entry helper windows for viewing, editing, and assigning the style and layout properties of each element or document section in your report design. Learn more about this functionality on the Stylesheet Designer page. To meet the specific rendering requirements of XBRL financial reports, StyleVision includes an easy to use XBRL Table Wizard. Learn more about this feature on the XBRL Rendering page. Conditional Templates Conditional templates add to StyleVision’s multi-channel publishing capabilities, enabling you to apply advanced dynamic functionality to your design. Conditional templates are based on XPath expressions and allow you to design forms with layout and presentation that changes based on source data in the XML file(s) or database. Advanced publishing protocols like output-based conditions enable you to display multi-channel content differently depending on its delivery format. Conditions for specific output can be placed around individual parts or components of the document, thus providing considerable flexibility in the way the different output documents are structured. For example, HTML output may require functionality like hyperlinks or special instructions that are not necessary for print output. Content Editing StyleVision designers can also easily create and distribute electronic forms for editing using Authentic, Altova’s low cost XML and database content editor. Together, these two applications provide an easy-to-use and powerful content editing framework that lets developers create a robust data entry application that can publish output to multiple channels. For more information, see the Authentic Forms Design section. Functions Multi-channel publishing templates designed in StyleVision support advanced functionality such as auto-calculations, business logic validation, and much more. Read more about advanced stylesheet functions. Charts & Graphs StyleVision also supports creating detailed multi-channel documentation with visual representations such as charts and graphs. As with all StyleVision designs, charts can be rendered for multi-channel output in HTML, RTF, PDF, Word 2007+, and as electronic forms. For more information, see the Charts & Graphs feature page. Check out StyleVision and add true flexibility to your business documentation with powerful support for multi-channel publishing. Download a free 30-day trial of today!
New Feature : Authentic® Scripting in StyleVision®
StyleVision has really benefited from some very cool new features in our past and current releases – absolute positioning, editable variables in eForms, global templates, and of course, charting, bring power and flexibility to your report generation and electronic forms designs. Now with our 2011 release, the addition of an integrated scripting environment expands on these features, giving you the ability to create robust data entry applications for Authentic users. Scripting functionality is embedded directly into the StyleVision design (SPS) so that Authentic end-users only need to open an eForm to start updating XML and database sources. Event handler and macro components can be written using supported scripting languages, JavaScript or VBScript, and you can also design input forms graphically using drag and drop functionality. To embed scripting functionality in a StyleVision design (SPS), open the Scripting Editor window via the Authentic | Edit Authentic Scripts menu command or by choosing Authentic Script from the Design tab context menu. The Scripting Editor provides an interface through which you can create any of the following four main components:
Global Declarations The GlobalDeclarations component is presented by default in every scripting project. Variables and functions are added using code fragments written in the scripting language (JScript or VBScript) associated with your project. An example function, StartChangingAddress, appears below: Variables or functions created in the global declarations script are accessible to all forms, event handlers, and macros in your scripting project. Macros Macros let you create functions that are called from other scripts or event handlers. For example, the macro shown below uses the GlobalDeclarations, including the StartChangingAddress function, to create a form for adding information to an active XML document.
  Macros can be specified and associated with StyleVision design elements using the Authentic group in the Properties window. Object events that are supported for macros are:
The scripting editor provides a folder which contains the full set of events for which event handler scripts can be written. Forms The Authentic Scripting Editor lets you graphically build forms using a palette of objects such as text input fields, buttons, labels, and more. General form properties such as size, background color, font styles, etc. are defined in the Properties pane.
  The form object palette provides all of the objects that are available. Registered ActiveX controls can also be added by selecting the Add ActiveX Control command in the right-click menu.
  Once an object has been inserted in your design, you can specify its appearance properties – such as alignment, borders, scroll bars, etc. – in the Properties pane.
Scripting in Practice
Authentic View scripting gives StyleVision designers complete and flexible control over various aspects of the user interface. In addition, extensions to the existing COM APIs add more flexibility for scripting and interactive eForm design. For example: Interactive object-specific design elements – such as the click of a button, modification of form elements, focus change between fields, etc. – can be accessed through the Authentic interface. User actions include OnClick, OnBeforeLinkClick, OnBeforeChange, OnAfterChange, OnSetFocus, and OnKillFocus. Entry helper windows can be suppressed to ensure that Authentic end-user access is limited only to modification of the intended elements, attributes, and entities. Context (right-click) menus can be completely customized by removing existing or adding new commands.
  New toolbar buttons can be created and associated with macros, giving the designer the ability to add completely new commands to the toolbar.
  Custom and standard toolbars can be modified by disabling any buttons that the end-user should not have access to.
  The COM API has also been extended with new interfaces and additional methods and properties including:
Check out all of this new functionality and more – download a free 30-day trial of StyleVision today!
MissionKit 2011 Now Available in Japanese
With the release of Version 2011 we are thrilled to bring you the Altova MissionKit in Japanese. Now all the Altova tools available in the MissionKit have been fully translated into Japanese. Like the English and German versions of the tool suite, the fully translated Japanese language version provides users with powerful functionality for XML and Web development, data mapping and integration, rendering and publishing of XML, XBRL, and database data, UML modeling, and more. All the tools available in the new Japanese language version of The MissionKit are available at the same cost as the English versions, and current Version 2011 users can now unlock any language version using their existing key code. If you haven’t checked out our latest release – Version 2011, download a free, 30-day trial today! The Japanese language version of all the MissionKit tools can be purchased from the Altova Online Shop or through your preferred reseller.
Altova Receives ‘2010 Best of Beverly’ Award
We are proud to announce that Altova was selected for the “2010 Best of Beverly” award in the Computer Software Development category by the U.S. Commerce Association (USCA)! The USCA “Best of Local Business” award program recognizes outstanding local business throughout the country and each year identifies companies they believe have achieved exceptional marketing success in their local community and business category. We are proud to be recognized by our local community for our success in the software industry as well as for the contributions we’ve made to the local area, such as committing to use renewable energy. And be sure to check back often to learn more about what we’ve been up to, including the most recent software release – Altova MissionKit Version 2011 – to helpful Tech Notes, the latest industry buzz, and other Altova awards.
New Software Feature: Charting in DatabaseSpy 2011
Charting SQL Query Results A link in the Altova DatabaseSpy 2011 SQL Editor Results window toolbar opens the Chart Selection dialog to initiate data charting. The chart tool icon opens the Select columns dialog, where users can specify which column of the Results table to use for the X-axis. Users can also change the order of value columns, or even leave one or more results column uncharted. This feature permits multiple charts to be generated for subsets of data from a single query that retrieves many table columns.
  The data is initially plotted using the default chart type and settings in a new Charts window. Like other DatabaseSpy helper windows, the Charts window can be unpinned, moved, and resized, as a floating window. The Charts window has nine tabs that permit users to specify properties of nine different charts that can even be assigned to different query results.
  The Change Type dialog gives users instant access to a wide variety of other chart styles.
  Within each chart type, sub-menus specify all the details of the chart appearance. Numerous customization options are available for each chart type, including chart titles, foreground and background colors, definition of axis ranges and labels, control of fonts, text colors and sizes, and more. A pull-down menu also lets users save and reload customized chart settings in files, for instance to store standardized chart styles and reuse them with multiple query results. The screenshot below shows a few of the settings for the line chart at the top of this page, which illustrates the same temperature and humidity data shown in the SQL query screenshot.
  The screenshot below shows a bar chart reporting total sales for the year to date by sales territory. This is a typical example of a chart style that can be reused in a report that is frequently updated with the latest sales data.
  Multiple Charts from a Single SQL Query Results Table Generating multiple charts from the same SQL query is simple and straightforward by selecting different columns of data in the Results table. The SQL query in the screenshot below returns the population and land area of the boroughs that make up New York City:
  Users can choose any tab in the Charts window, then assign data by clicking the Select Data menu option in the Charts window menu bar.
  Here are examples of an ordinary pie chart and a 3-D pie chart generated individually from the population and square miles data columns of the Results table:
 DatabaseSpy 2011 lets users change the chart colors by selecting an alternate palette or any custom colors.
  Gauge Charts from a Single Value or Calculated Results Gauge charts are used to illustrate a single value and show its relation to a minimum and a maximum value. For a round gauge chart, users can specify the beginning and ending values of the range, and the starting and ending locations on the gauge. DatabaseSpy 2011 enables complete gauge customization through selection of the background color, border color, needle color, text font, size, and color, and more.
  DatabaseSpy 2011 can generate charts from results tables that contain relational data, or from results of calculations performed by SQL queries. Gauge charts are a good fit for illustrating a single calculated value. The screenshot below shows a percent of quota calculation in a DatabaseSpy 2011 SQL Editor window, based on a table of stored daily sales and sales quota data.
  The calculated value can be more dramatic when represented in a bar gauge chart, where DatabaseSpy 2011 permits multiple background colors defined by ranges along the axis, as shown below.
  Export Charts for Reports DatabaseSpy 2011 exports charts to image files in .png, .bmp, .gif, or .jpg files in customized sizes, independent of the size of the chart window on the screen to create eye-catching visual elements in reports of all types.
  Whether you are a developer, business analyst, research professional, or other database user, DatabaseSpy 2011 can generate elegant charts from SQL query results to illustrate your data reports – download a free 30-day trial today!
If you’d like to find out for yourself how well DatabaseSpy works with other Altova tools, download a free trial of the Altova MissionKit.
New Software Release : MapForce 2011
Chained transformations Support for chained transformations lets you create complex mappings where the output of one mapping becomes the input of another. This is a powerful feature that adds to MapForce’s ability to execute fully automated transformations. Each chained component becomes a modular entity in an interdependent transformation sequence, allowing for conversions to be made on-the-fly. You can create chained transformations using any number of mapping components connected to a final target component. Preview and code generation features can be displayed/generated for intermediate components, as well as for the final mapping result. Intermediate mapping components also now have a "pass-through" button in the title bar that lets you define the set of data that gets passed on to the following component.
For example, the mapping above shows a chained mapping where the pass-through button is active and sample data is assigned to component A. The output preview offers two separate sets of data: XML that conforms to the Contacts.xsd schema and incorporates a subset of data mapped from the Employees.xml sample file, and XML that conforms to PersonList.xsd using data from the Employees sample file. In both cases, the data has been amended with the relevant constants and functions that are shown in the MapForce design pane. Integration with StyleVision for output components Support for Global Resources throughout the MissionKit has already offered you some integration between Altova software applications… But this feature takes that integration to a whole new level, allowing you to render XML and XBRL output from your data mappings into HTML, RTF, PDF, and Word 2007+ using an associated StyleVision template design. This essentially combines MapForce’s any-to-any data mapping capabilities with a sophisticated rendering engine, meaning that you can now automate report generation from virtually any data format that can be mapped to an XML Schema or XBRL taxonomy. In the example below, a StyleVision design has been associated with the mapping by simply right-clicking the output file and browsing to select a suitable SPS file using the Component Settings dialog.
  Once the SPS file is entered or selected, you will be able to simply click on the relevant format tab (i.e., HTML, RTF, PDF, or Word 2007+) to view rendered data.
  Formatting of numbers, dates, and times Probably one of the most requested features, this lets you easily convert numbers, dates, and times to their string representations using several different formatting functions. For example, the simple format-number function below converts a numerical input (e.g., 12345) to a monetary one in with a USD prefix, comma separating the thousands digits, and two decimal places (e.g., $12,345.00).
  This post really just scrapes the surface of what the new MapForce release has to offer -download a free 30-day trial of Mapforce today to experience all of these new features and more!
New Software Release : StyleVision 2011
On September 8, Altova released v2011 of the MissionKit with the addition of powerful reporting functionality across many of the products. Specifically, StyleVision has been supercharged with a multitude of new features, securing its place as an advanced and versatile business intelligence application, priced for today’s market. Let’s take a closer look at the exciting new features in StyleVision 2011 including:
Charts as a new design element StyleVision joins other MissionKit 2011 tools with support for charting, adding to its already advanced general purpose reporting capabilities to create a highly scalable decision support tool for XML, database, and XBRL content. As with all StyleVision designs, charts can be easily rendered for multi-channel output in HTML, RTF, PDF, Word 2007+, and electronic forms. The following types of charts are available:
The chart configuration dialog lets you use XPath to select data for your charts. This can be as simple or as complex as you want, running the gamut from database data that is already laid out in a tabular format to XML files where the nodes you need to select are spread out over hundreds of lines of code. Pssst… if you’re thinking that this would be great for the unique demands of XBRL, read on because we created something special with that in mind ;). Here are a couple of examples of charts that you can build in StyleVision:
 Yup, you can even chart completely different sets of data on the same graph. How creative you want to get with your visual analysis reports is really up to you. You can even create interactive charts for use with Authentic – allowing end users to manipulate eForms to view the desired result. For example, the screenshot below shows the Authentic view of a pie chart where a drop-down menu (combo box) selection dictates the subset of data that is represented.
  Charts are easily integrated into your StyleVision report templates at any point by simply dragging the relevant node onto the design pane and choosing Insert Chart from the context menu. The Chart Configuration dialog can then be used for chart settings (choosing chart type and style) and data selection (populating your chart axes with the relevant data from the source).
  You can even use Dynamic XPath Settings to apply transactional data to your chart. Of course, if you sometimes have trouble telling your .s from your /s, you can always get some help with more complex expressions from StyleVision’s XPath Builder. Chart wizard for XBRL files If you are familiar with XBRL, you are intimately aware of the complexities associated with navigating XBRL taxonomies. And, if you’re impressed with what you’ve just read about StyleVision’s charting capabilities, you are probably trying to remember where you put that old XPath reference guide. Not to worry! StyleVision has added to its XBRL rendering support with an XBRL Chart Wizard that lets you easily select data and define presentation settings for your XBRL reports.
  Concept and Period Properties dialogs are included to let you specify which elements should be included and how periods (instants or intervals of time) should be handled in your chart. Explicit support for HTML/CALS tables StyleVision now provides direct support for HTML/CALS tables, meaning that it will automatically recognize values dictating table structure (column number, row height, etc.) and apply them to rendered output. (v2011 adds support for rendering HTML/CALS tables in HTML, RTF, PDF, AND Word 2007+ – previous releases have supported output to Authentic eForms.)
  You can also easily assign additional presentation styles to HTML/CALS tables using the Edit CALS/HTML dialog.
  Ability to import existing XSLT files Well, I’m sure a few of you were hoping that this one was coming soon… You can now base your StyleVision template designs on existing XSLT files that were designed for HTML output or XSLT files with XSL:FO commands that were designed for output to PDF. Simply choose the New from XSLT File option and presto change-o, your design will be fully manifested in the design pane. Now you can edit your template using StyleVision’s graphical interface and output to even more formats (HTML, RTF, PDF, Word 2007+, and Authentic eForms) with just the click of a button. Scripting & toolbar editor for Authentic This feature is just way too cool not to devote an entire post to it, so keep your eyes peeled for a full description coming up on this blog. In the meantime, check out the Authentic scripting page for a brief description and examples. Better yet, just download a free 30-day trial of StyleVision today to test drive all of these new features for yourself!
XMLSpy Version 2011
Creation of charts & graphs from XML data
Like several other tools in the MissionKit 2011, XMLSpy now supports chart and graph generation. Chart creation is unique to XMLSpy and brings a whole new dimension to working with data in an XML editor. Now you can visualize and analyze numerical XML data – and XBRL data – directly inside XMLSpy with just a few clicks. No more exporting to Excel! The following types of charts are available:
Below are two example charts that show just some of the possibilities for representing XML data in attractive, meaningful way – with just a few clicks:
 To create a new chart, simply highlight a range of data in Text View or Grid View, right click, and select New Chart. You can also specify the data to chart via XPath expression. Once you’ve used the Select Columns dialog to specify which data you want displayed, either via XPath or by highlighting it in the window, and how you want to display it….
  …you can choose the type if chart you require, and the appearance of the chart, from colors to fonts and more. You can create up to nine different charts on the available tabs in the Output Window, and you can save each as a custom-sized image file with just a click or print it directly from XMLSpy. You can also copy it to your clipboard to paste it in another application, such as Microsoft® Word or PowerPoint. One of the coolest aspects of these charts is that they’re totally dynamic. Once you make a change to the underlying XML data, the chart can be instantly regenerated, either automatically by hitting Reload, depending on your preference. What’s more, you can copy the XSLT or XQuery code to create the chart to the clipboard for use in your own stylesheet or application. The XSLT/XQuery code can be executed in XMLSpy and via AltovaXML 2011 Enterprise Edition, Altova’s XML standards processor. Chart support extends to the XMLSpy XSLT profiler and XQuery profiler, as well. After profiling an XSLT or XQuery execution, one click creates a chart to help you immediately visualize the results based on one or more criteria. This makes it easy to immediately interpret the results of a profiling an XSLT or XQuery execution or to communicate those results with other team members in a powerful, visual way.
Validation of SOAP messages
Requested often by our customers, this new feature will be very useful for Web services developers, as it allows them to ensure their SOAP messages are valid against the SOAP specification as well as any XML Schemas referenced in the corresponding WSDL definition.
Schema flattener
The new schema flattener in XMLSpy 2011 allows schema designers to write all the dependent files that are included in a schema into one file. This way, you can use the flattened XML Schema without having to rely on a network connection to access the required files. This could be especially important when shipping a schema within an application.
Schema subset picker
Many schemas are quite large and contain more types and elements than are required for a particular application or information exchange. Furthermore, the larger a schema is, the longer loading and validation may take. The ability to create a new schema from a subset means a developer can select some global elements or types from a large schema to create a smaller one, using just the elements required. This feature is especially useful for working with NIEM information exchanges, but has also been requested by other users for a variety of applications. Read about all the features added to the Altova MissionKit tool suite or download the latest version now. If you’re a current customer with an active Support & Maintenance Package, you can update to v2011 for free.
UML Database Modeling in UModel 2011
As software applications interact with growing amounts of data, database designs and structures become critical to development of successful projects. UModel® 2011, just launched on September 8, 2010, adds a new feature that empowers users to extend software modeling functionality by modeling relational databases along with Java, C#, and Visual Basic software applications. UModel 2011 accelerates database modeling with features that permits users to:
UModel Database Diagram Elements UModel 2011 database diagrams support all the following database elements:
Import Existing Database Structures Users can import an existing relational database via a selection in the UModel 2011 Project menu. The Import SQL Database option opens the UModel 2011 Database Connection dialog, with the Database Connection Wizard and all the additional connection options available in DatabaseSpy and other Altova MissionKit tools that interact with popular relational databases.
  When importing a database, UModel 2011 also automatically adds a database profile to the project. UModel 2011 database diagrams are displayed in a special category in the Diagram Tree Helper window.
  Modifying Databases in the Model UModel 2011 database diagrams use a dedicated toolbar with icons indicating database elements that are shared with DatabaseSpy, easing the learning curve between tools.
  As editing proceeds in UModel 2011, the SQL Auto-completion helper window assists with creation of diagrams valid for the SQL database type.
  As an alternative to working directly in the diagram, users can also edit database elements in the Properties helper window.
  Database Change Scripts When a developer synchronizes program code from the UModel project, changes in any database diagram generate a Database Change Script with SQL commands to implement the revisions. Database Change Scripts created in UModel can be saved as SQL files, executed directly in the database, or opened in a DatabaseSpy SQL Editor window via a convenient button in the UModel Database Change Script dialog.
  Conversely, if another team member modifies a table directly in the database, a developer can update the UML model by merging the database changes.
  After synchronization of the UML model with the latest version of the database, the database diagram shows a new column in the Teachers table.
  Like all other UModel diagram types, UModel 2011 lets users save database diagrams as image files and include them in automatically-generated project documentation. Visit the Altova What’s New page to learn more about all the new features in the Altova MissionKit 2011. Model databases along with system requirements, business rules, and application code for your next development project – click here to download a free 30-day trial of UModel 2011 today!
Altova MissionKit 2011 is Now Available!
CHARTS
Charts can now be generated and used in the MissionKit 2011 XML and database tools in a variety of ways. The following types of charts and graphs are available for providing a graphical representation of numerical data:
Charts are fully dynamic and can be automatically or manually regenerated when backend data is updated. XMLSpy You can create a new chart directly in the XML editor by simply highlighting a range of data in either Text View or Grid View and selecting New Chart from the right-click context menu.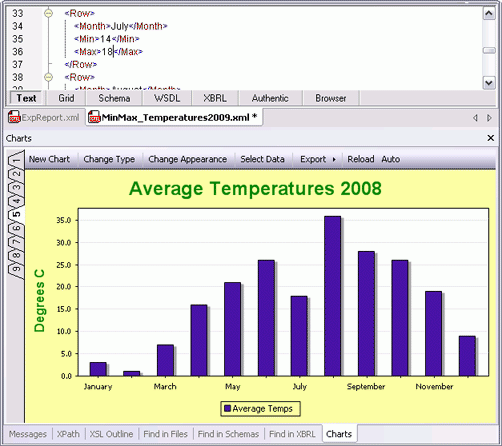 The chart’s appearance, labels, and so on, are highly customizable, and your finished chart can be printed, copied to the clipboard, saved as an image, or – and this is truly unique – exported as XSLT or XQuery code for use in your own stylesheets, reports, or apps.
 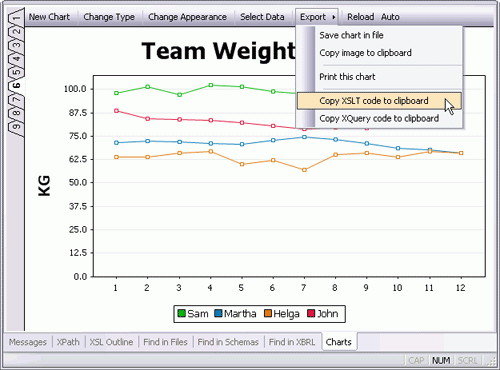 XMLSpy is the first and only XML editor on the market to support this powerful functionality, giving our users a distinct advantage when it comes to analyzing and interpreting XML data. You can also create a chart to visualize the results delivered by the XMLSpy XSLT Profiler and XQuery Profiler, making it easy to interpret and communicate performance data. StyleVision Charting and graphing support in StyleVision 2011, the stylesheet and report design tool, allows you to present data in a powerful, visual way, so that it can be easily analyzed from a variety of different angles. When you’re creating an XML, database, or XBRL report (or even a data entry form for use in Altova Authentic), it’s easy to specify your chart parameters via XPath and then customize the appearance of your chart or graph.
 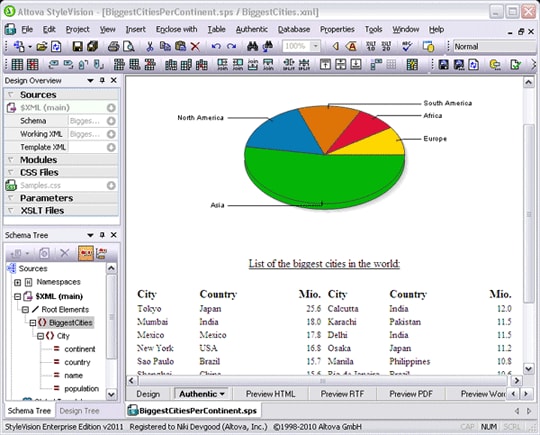 You can even utilize dynamic XPath settings to apply dynamic data from your source to the settings of your chart. For example, if you have a chart that shows regional data, you may wish to reflect the name of each region in the title of your chart. If there are several Region elements, the data for the chart title can be selected dynamically via an XPath expression depending on which set of data is being presented in the chart. Charts are integrated in multi-channel StyleVision reports, described further below. DatabaseSpy Relational database data often lends itself perfectly to a graphical representation, but it’s not always easy to create charts to analyze relationships locked away in database tables. Now, with DatabaseSpy 2011, it’s as simple as selecting the column(s) you wish to chart.
 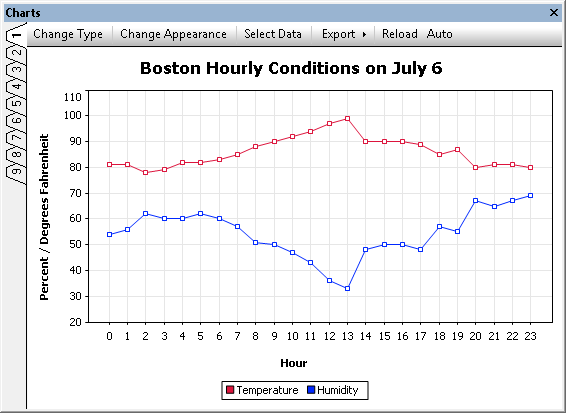 You can even generate and save charts based on calculations performed in a SQL query – such as averages, percentages, etc. As with XMLSpy, charts may be saved as image files, printed, and copied to your clipboard. DatabaseSpy supports all major relational databases, and even with this charting functionality and its other advanced tools, it’s ridiculously affordable.
REPORTS
StyleVision The new chart creation functionality described above adds a whole new level of sophistication to Altova’s general purpose reporting tool, StyleVision. While you’ve been able to design attractive XML, database, and XBRL reports in previous versions of StyleVision, now you can also include dynamic charts for full featured, multi-channel reporting in digital formats like HTML and e-Forms, and print media including Word and PDF. Advanced options such as drag-and-drop design, absolute positioning, modular designs, conditional templates, support for importing and/or reusing existing XSLT stylesheets, dynamic data selection, and more, combine to make StyleVision robust solution for business reporting on any scale.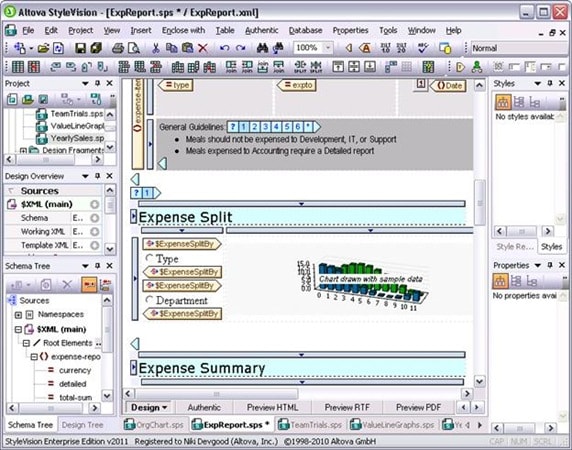 In fact, StyleVision now integrates with MapForce – so you can design reports for virtually any type of data. MapForce Starting with Version 2011, MapForce supports integration with StyleVision, allowing MapForce users to automatically render results of their XML and XBRL mappings using an associated StyleVision report design. This very powerful feature essentially combines MapForce’s any-to-any data mapping capabilities with a sophisticated rendering engine, meaning that you can now automate chart and report generation from virtually any data format – including databases, flat files, Excel, EDI, and more – that can be mapped to an XML Schema or XBRL taxonomy.
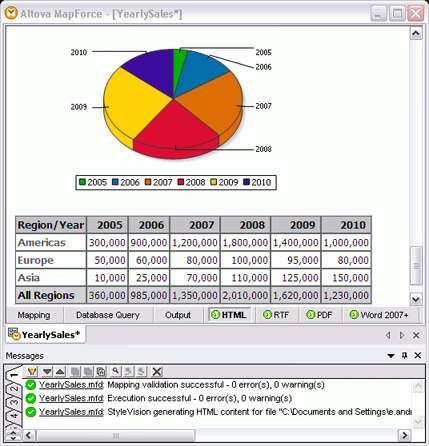
DOWNLOAD VERSION 2011
Whether you need to generate charts while working with XML or databases, or you need to design full-featured reports with dynamic, multi-channel output, we hope you’ll check out the new MissionKit 2011. Then, post a comment here on the blog to let us know what you think! Upgrade or Download a Free Trial See more details and screenshots, or download Version 2011 now. Current customers with active support and maintenance can download the new version for free. A fully functional 30-day trial is also available.
STAY TUNED…
More details about all the new features added in Version 2011 will be posted in the coming days.
August MissionKit Special – Upgrade Now and Save!
Get one year SMP FREE when you upgrade to the Altova MissionKit! For a limited time*, we are offering our current customers the opportunity to get one full year of Support & Maintenance free when they upgrade their individual software product license(s) to the MissionKit tool suite. This represents a potential savings of hundreds or even thousands on Support and Maintenance! The MissionKit brings together innovative tools and standards-based technologies in a comprehensive package that every enterprise architect and application developer needs to complete their software development arsenal.
Take advantage of this exciting offer to upgrade to the MissionKit today – it expires on August 31, 2010!*
SMP includes:
Free Software Updates You will receive all maintenance releases and major software versions that are released during your support period – including v2011 as soon as it ships this autumn. Updates that you receive cover the specific edition of the product that you have purchased and typically include many additional features. Priority Technical Support We are extremely proud of our high quality technical support; here are just a few actual customer comments about our excellent support team. “Thanks again for the quick reply. You guys have the fastest response time and in my opinion among the best customer/technical support I have dealt with.”– Sacha Korell, Cobham, plc. “Thank you for the clear explanation and rapid response. Altova provided an excellent customer service for an excellent product.” – Ray Burrows, Ensign Energy Services, Inc. “Working with Altova Support has been my best support experience in my professional life. I really appreciate the way you have understood my obstacles and used your time to remove them. Thank you!” – Frode Reinertsen, NetCom GSM * This limited offer expires on August 31, 2010 and is available from Altova GmbH and its licensed distributors and resellers. The twelve (12) or twenty-four (24) month Support Period for the MissionKit SMP commences on the date that the upgrade order is received and replaces any existing SMP Support Period then in effect for the upgraded licenses. Pricing will automatically reflect that 12 months of the Support Period are at no cost.