New XML Grid and More in v2021r2
In the latest release of Altova desktop developer tools and server software products, we’re introducing a completely rebuilt XML Grid View, support for XSLT3 for XML data mapping, statistics and charts for monitoring FlowForce Server, and much more. Let’s take a look at the highlights of Altova Software Version 2021 Release 2.

All New XML Grid
Editing XML in a graphical view has numerous benefits that have made XML Grid one of the most popular views in XMLSpy for many years running. Now XML Grid has been completely rebuilt to take this editing paradigm to the next level, allowing developers to not just visualize, understand, and edit an XML document more easily – now they can achieve far more than is possible in a text editor alone.
New features include:
- SmartFix XML validation with automatic error correction
- Customizing the display to suit current content
- Automatic image display
- Easy creation of XPath filters
- XQuery formulas to calculate a result or generate a nodeset
- Pasting content to/from external apps (text editor, Visual Studio/Eclipse, Excel…)
- Customizable grouping of nodes for very large XML files
See an overview of all the new functionality in this demo video.
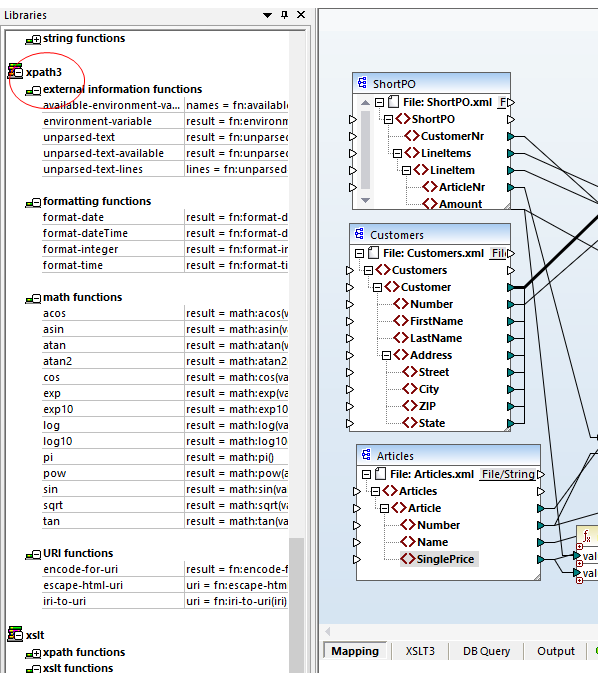
XSLT 3 for XML Mapping
MapForce auto-generates XSLT for automating XML to XML data transformations. Now, in addition to XSLT 1.0 and 2.0, MapForce supports the latest version of the XSLT standard.
XSLT 3.0 is considered a major upgrade from previous versions of the transformation language and includes an extended set of functions. These are now available in the MapForce Function Library when XSLT3 is selected as the transformation language.
Charts Dashboard for FlowForce
FlowForce Server includes a helpful web interface for managing all aspects of workflow automation. Adding to detailed logging of FlowForce Server jobs, a new visual dashboard offers charts and statistics that help administrators monitor the progress of FlowForce Server jobs, as well as performance of the server itself, in great detail.
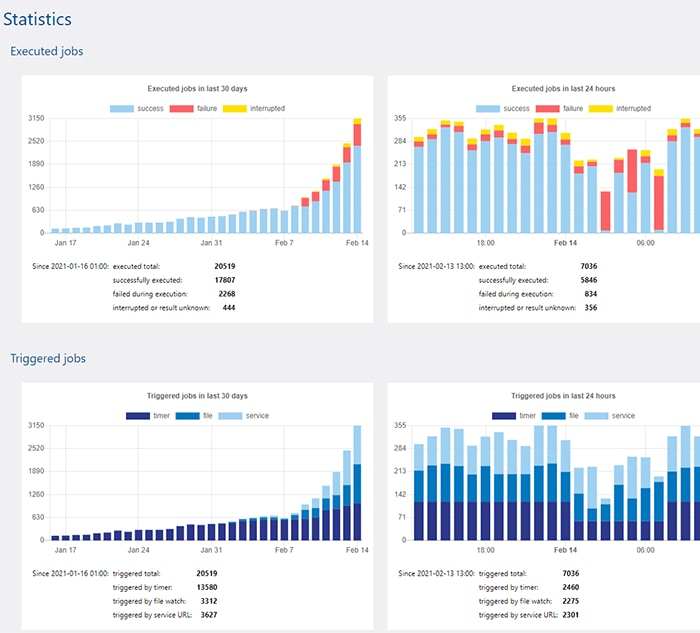
All charts include hyperlinks to corresponding log view for quick inspection and troubleshooting. Charts are customizable and allow server admins to:
- Understand the state of current FlowForce jobs at a glance
- Visualize the FlowForce Server load (how many jobs are executed per time interval)
- Visualize the fail ratio to understand how many jobs didn’t finish successfully
- See how many jobs were started via service URL and via time or file triggers
- Quickly note any abnormality in a number of executed jobs
- Quickly navigate to log view records in at a specific time interval highlighted in the results
Update to the Latest Version
Read more about all the new features and download an update (or a free 30-day trial!) now.