Mobile App Development: A User Story
Ahh spring! Birds singing, flowers blooming, and the sun rises earlier and sets later. All that extra daylight gives solar power generation systems more hours to make electricity. As the summer solstice approaches, solar generation systems enter their most productive time of year.
Owners of rooftop solar systems can be passionate about tracking their productivity. The actor and comedian John Hodgman even moderated a disagreement over obsessive monitoring of solar production. My friend Kasey is also enthusiastic about solar power. Whenever I see Kasey, she reports her latest kilowatt-hours stats. Kasey’s home is in a warm, sunny climate where air conditioning is her biggest electricity demand. She installed solar panels on the roof of her house at the end of last June and her system raced to generate enough power during long summer days to offset her air conditioning.
After receiving the electric bill for August, Kasey called her solar installer to report success – her home’s electricity consumption for the month was zero. “I have to confess, I read my meters every single day to see how the system is doing,” Kasey told the installer.
“Everybody does it,” the installer replied. “Some users even tell me they check the meters three times a day!”
Kasey asked me if a mobile phone application built with MobileTogether might make a good reporting tool for her solar power system. “I could enter the meter readings into my phone,” she said. “I can do it every day when I take the dog out before breakfast.”
That’s how our mobile app development collaboration began. The result is the MobileTogether app we call Solar Power Tool.
Kasey’s solar system includes software to report the amount of electricity produced, but that’s only half the equation. Like many residential solar generation systems, Kasey’s home connects to the utility power grid with net-metered billing. Solar panels provide power to the home only while the sun is shining. Electricity comes from the grid at night or whenever demand exceeds production. When the solar panels produce more electricity than the home consumes, the excess is fed back to the grid to supplement utility generation capacity.
The monthly power company bill reports how much power the home produces and consumes each month. The account holder pays for any excess consumption plus a small connection fee. Extra production is credited to the following month’s bill. These homes have two meters--one meter records electricity produced, and the other records electricity consumed.
Kasey wanted an app that would monitor the balance during the month instead of waiting for the power company bill. We created a list of requirements for mobile app development:
- provide a very simple data entry form to capture meter readings,
- automatically calculate the account balance from the readings,
- display daily performance and monthly balance numerically and graphically,
- track the surplus over time to show changes from month to month.
MobileTogether has all the features we needed to elegantly implement the app requirements. We started by defining XML data structures for daily and monthly records. Shown here is the monthly data in XMLSpy grid view:
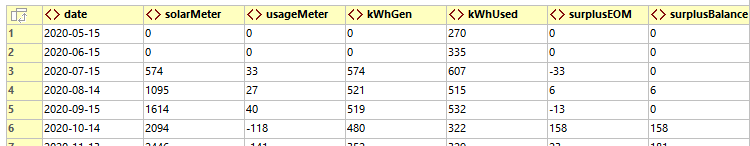
Reading across past the date and meter values, columns 4 through 7 for kilowatts generated and used, monthly surplus, and total balance are all simple numeric calculations. Looking at row 5, for instance, kilowatts generated (kWhGen) is simply the solar meter reading for September minus the reading from August. The solar meter only runs forward, but the usage meter runs forward or backward, depending on sunlight and power consumption from hour to hour.
For our next step in mobile app development, we designed the top-level flow of the app. We decided to create two main pages, one for daily performance, and one for monthly history. The data entry forms would be sub-pages accessed from each main page. Here is the MobileTogether Pages helper window showing the page structure:
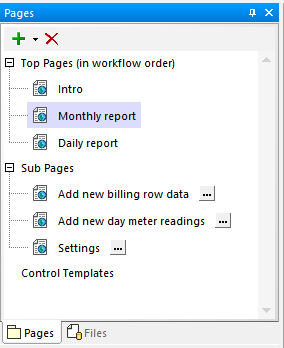
Buttons on each page apply MobileTogether actions to navigate between views.
Then we thought about how to graphically illustrate the data in charts. MobileTogether lets developers build up charts in multiple layers, even combining different chart types. We decided to combine area charts and bar charts. We picked an area chart in the background to represent electricity consumption, by day and by month, and a bar chart overlay to show solar production. Our logic is that the home uses electricity continuously, even in the middle of the night for the refrigerator, electric clocks, phone chargers, etc. Solar production is intermittent, starting at sunrise and ending at sunset.
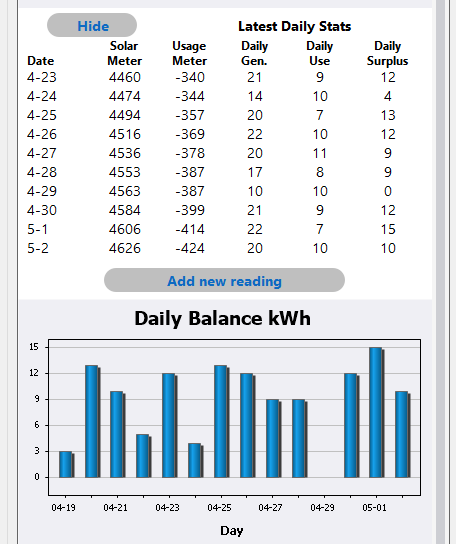
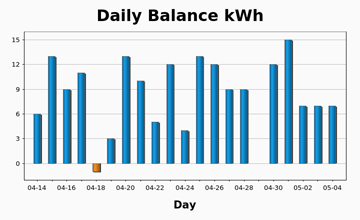
The Simulator is a feature of the MobileTogether Designer that instantly executes the solution during mobile app development to test logic, view the UI as it will appear on a variety of iOS, Android, or Windows devices, and examine changes in workflow data. Here is a view of the top Daily report page, as seen in the Simulator:
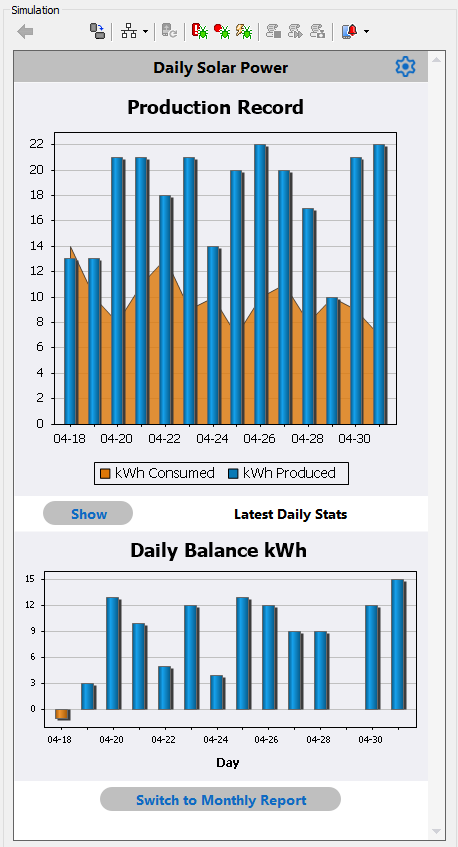
This page reports 14 days of production starting April 18. Solar production varies greatly from day to day based on cloud cover, as we see in the top chart. The bottom chart shows the positive or negative balance each day. On April 18 one more kilowatt was consumed than produced, and on April 29 the balance was zero.
The Show button under the first chart opens a numeric table of the data:
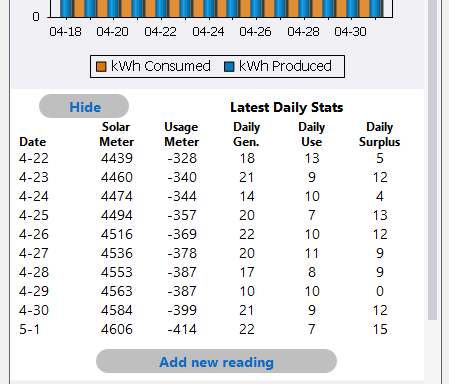
The Show button manipulates the MobileTogether Visibility property of the data table. The table itself is scrollable within the page and contains data for the full preceding month. The Add new reading button opens the data entry subpage for a new set of readings:
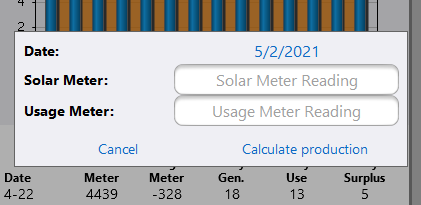
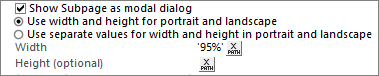
The Control action definition for the button lets us open the page as a modal dialog, which means the original page is still visible in the background.
MobileTogether let us add hint text to the Entry Field controls for the meter readings. We also used the MobileTogether Keyboard property. When Kasey taps the Edit Field to enter a new value, only numeric characters are displayed.
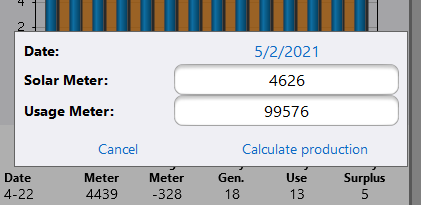
After entering the readings from both meters, Kasey’s next step is to click Calculate production:
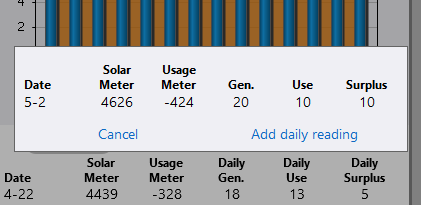
This performs XQuery calculations to generate the daily production data for preview. Kasey will then either add the new data or cancel the input. Adding the new daily record also automatically updates the charts on the daily report page:
The monthly report page is set up similarly to the daily report. Shown below are two views of the monthly page on an Android phone, in Dark Theme and Light Theme:
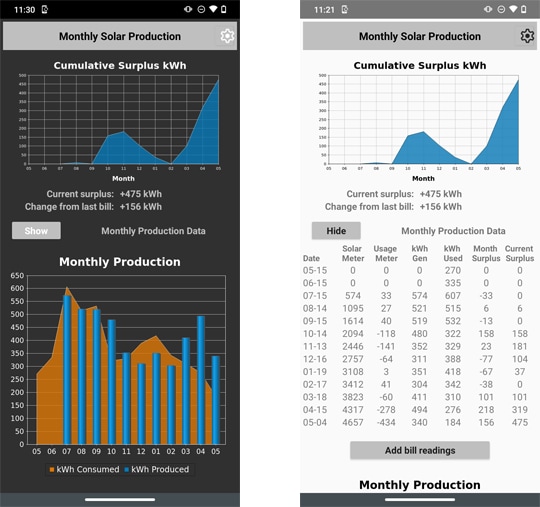
The data table on this page displays monthly stats. The first 12 rows are based on meter readings from Kasey’s utility bills with values in columns 4-7 calculated by the app. Row 13 is based on the last daily reading entry. Every time Kasey adds a new daily reading the app updates the daily data table and daily charts, and also automatically calculates monthly totals, replaces row 13 in the monthly table, and updates the monthly charts.
This solves the primary requirement for this mobile app development: to monitor the cumulative surplus since the most recent utility bill. The cumulative surplus is reported in row 13 of the monthly data table, in the caption below the first monthly chart, and in the far right entries in both monthly charts.
The gear icon at the top right of each page is a button created using the built-in MobileTogether button image for Settings. This opens a Settings page, shown here on an iPhone:
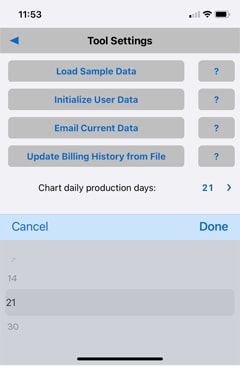
The first 4 buttons on the Settings page allowed us to manipulate and exchange data sets during development or for analysis. The last setting is a Combo Box that let Kasey reset the charts on the Daily reports page to show data for 7, 14, 21, or 30 days.
After initial mobile app development Kasey was thrilled with the results. Every single day she took her dog out for a morning walk and entered her meter readings. When her utility bills came in the mail, she updated the monthly table with the values recorded by the meter reader.
Then one day she called me. “You know I’ve been stuck at home for nearly a year, and now I’m ready to travel again,” she said. “What will happen to the app if I skip a few days’ readings?”
I had to think about that and built a test data set to find out. The upshot was the monthly report would be fine. Whether the user missed adding meter readings for one day or a week, the app always calculates the cumulative surplus from the latest bill and the last daily reading.
The daily report had a couple small issues. The date field for daily readings was a date picker control, automatically loaded with the current date, but the user could select another date if reading values were available.
But if a few days readings were missed, the daily production data and chart values for the last day were inaccurate -- all production and all consumption would be credited to the last day.
The solution was easy. We decided to add a bit of logic to the calculation of daily stats with an if-then test and a loop:
- if the date of the new reading was more than one day past the last reading, then count the missing days
- divide the total production and total consumption by the total number of days between readings.
- use a loop to assign the average production and average consumption to each missed reading day.
I implemented this logic in a MobileTogether Action Group and added the new action group to the steps performed when Kasey clicked the Add daily reading button.
Kasey happily left for a 3-day camping and hiking trip on May 2. On May 6, the morning after she returned, she entered daily meter readings as usual. Here are partial views of her daily report and monthly report with averaged values for missing daily readings, as seen on an iPhone:
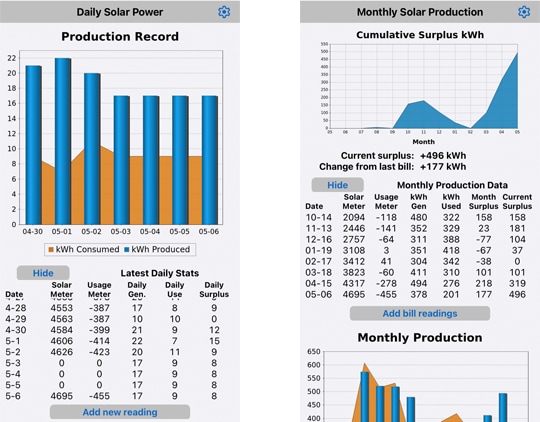
Zeroes for daily meter readings on May 3, 4, and 5 indicate averaged values.
If you’re doing cross-platform mobile app development, you need a tool with full-featured visual programming and integrated debugging! Check out our MobileTogether video demos, more sample apps, or even the online manual for a deep dive into all the info. When you’re ready to jump in and build your own cross-platform mobile apps in the fastest time, download the MobileTogether Designer to get started.