How to Debug XPath and XQuery Expressions
XPath and XQuery are powerful functional programming languages for selecting and querying data in desktop or mobile applications – and, in fact, XQuery was added to the TIOBE Index in early 2016.
When you’re writing XPath and XQuery statements, it’s vital to ensure your expressions return the desired results, and this can be a frustrating process of trial and error. The XPath / XQuery Debugger in XMLSpy makes it easy to test and troubleshoot your code, in the very same window where you’re developing your expressions.

Enterprise-grade XPath/XQuery Debugger
The XPath/XQuery editing window in XMLSpy makes it easy to build and evaluate expressions with features that let you focus on the logic of your statement, rather than simply typing it out: advanced entry helpers, point-and-click expression building, ready-to-use code snippets, mouse-over implementation guidelines, real-time evaluation, and other tools that go well beyond basic intellisense.
Even with the ability to view instant results of our expressions as you work, it’s often more useful to see output produced at each step of your XPath or XQuery execution, especially for complex statements – and that’s where the XPath and XQuery Debugger comes in.
The XPath/XQuery Debugger is the first of its kind, packing all the features developers expect in an enterprise-grade code debugger into a convenient interactive window.
The debugger lets you go step-by-step through the evaluation of your XPath or XQuery expression. Each click shows you the results for the corresponding step of the evaluation, and you can step into, step out, and step over evaluation steps using buttons in the debugger toolbar or function keys.
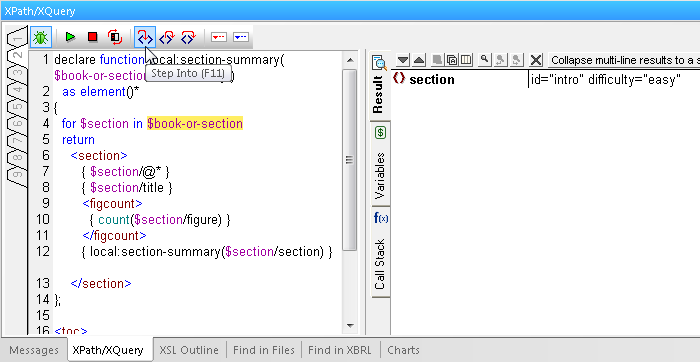
You can also set any number of break points (to pause evaluation) and trace points (to record the evaluation result at a breakpoint) to further examine the evaluation of your XPath or XQuery code.
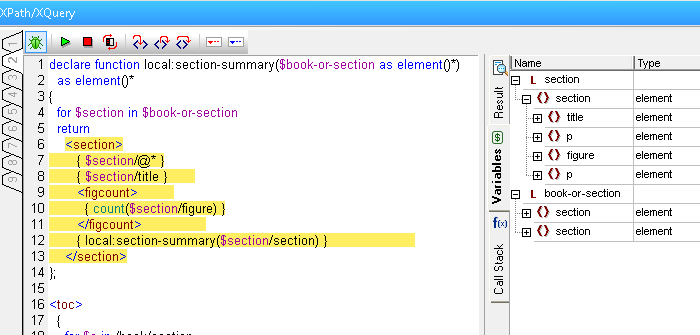
In addition to the main Result tab, the Results pane contains a Variables tab and Call Stack tab. During debugging, the Variables tab displays the variables of the current step and their values. The Call Stack tab displays the various processor calls up to that point in the debugging. The most recent calls are on top, and the current call is highlighted in both panes.
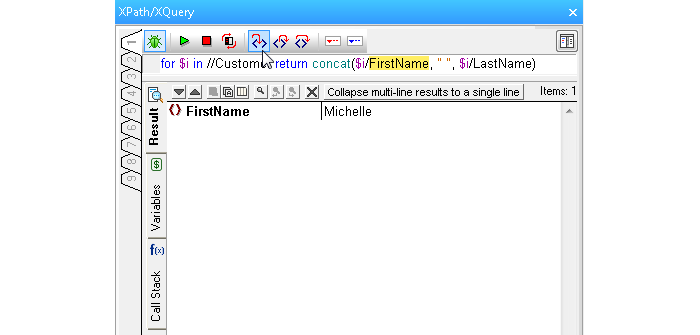
The layout button at the top right of the window lets you toggle between horizontal and vertical views of the XPath/XQuery editing and debugging window. You might prefer the vertical layout for longer expressions, such as those shown in the section above, but switch to horizontal view when editing or debugging shorter statements:
The XPath/XQuery Debugger window lets you debug your code in the context of the active XML file. XMLSpy also includes full-screen XQuery Debugger with the same debugging functionality for analyzing results of large, complex XQuery documents against XML databases on a server, and an XQuery Profiler for optimizing the performance of your code.
The addition of this powerful interactive debugger window to the XPath/XQuery Builder and Evaluator in XMLSpy makes it infinitely easier to compose and test XPath and XQuery code, saving developers time and frustration.
As always, XMLSpy already supports the latest versions of XPath and XQuery, giving you the flexibility to work with XPath/XQuery 3.1 or earlier versions of these important languages.
Try the new debugger now by downloading a free trial of XMLSpy!