Creating ESEF Filings Just Got Easier


To meet current mandates, ESEF (European Single Electronic Format) reports must be filed in XBRL. To accelerate the process, regulated companies can take advantage of intelligent software tools to fill the reports with data. One such tool from Altova allows organizations to create valid ESEF XBRL directly in Excel, where finance pros are already comfortable working. This allows them to create reports for filing without having to learn the intricacies of XBRL syntax.

Unlike some other XBRL filing mandates, ESEF requires filing companies to create their own extension taxonomy, which defines the entity-specific data rules for their report. To help customers with this step of the filing process, the Altova ESEF XBRL add-in for Excel includes a visual extension taxonomy designer that makes it a complete start-to-finish ESEF reporting solution.

Let’s see how it works.

Person working on a laptop with coworkers at desks in the background
Read more…
Tags: , ,

How to Get EBA XBRL from Excel


Like other regulatory agencies around the world, the European Banking Authority (EBA) has standardized on XBRL for the transmission of data submitted by filing entities. Benefits of using XBRL include increased accuracy and efficiency of supervisory practices and risk identification. The use of XBRL benefits filing organizations as well, because the now-standardized data can be easily validated and then used further for automated report generation and other common requirements.

However, the challenge lies in getting backend data into a valid XBRL format according to the EBA Taxonomy, especially since the employees recording the data are generally financial professionals and not familiar with XBRL syntax.

Let’s take a look at how EBA reporting tools can make it easier.

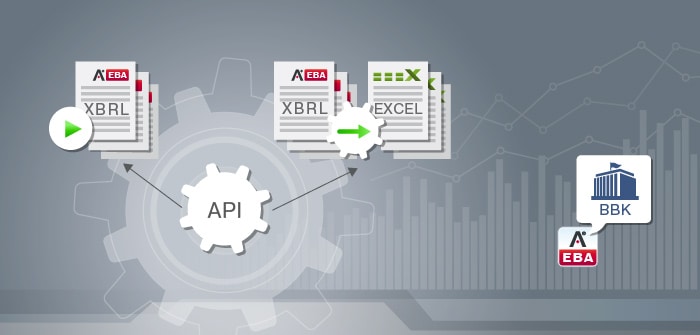
EBA XBRL from Excel

Read more…

Tags: , ,

ESEF Tools


The ESEF acronym has been top of mind for finance professionals across the EU and UK since mid 2019, when an upcoming reporting mandate from the European Securities and Markets Authority (ESMA) was announced.  

ESEF, which stands for European Single Electronic Format, is a digital financial reporting standard based on XBRL. As of early 2020, companies on EU regulated markets are mandated to prepare their annual reports in accordance with ESEF rules.

What exactly is ESEF compliance, and what does it take to meet reporting requirements? Let’s take a look at the basics and some tools that make it easy.

Finance pros
Read more…
Tags: , , , ,

Learn about XULE for XBRL


XBRL (eXtensible Business Reporting Language) is an open, XML-based standard for the electronic submission of business and financial data. Though XBRL specifies what data must be reported and provides a standardized way of doing so, companies and regulatory agencies need a way to ensure the quality of data that is submitted. One approach is by using business rule validation, and XULE is one method that is growing in popularity.

Read more…
Tags: , , , ,

Certified Tools for xBRL-JSON & xBRL-CSV


XBRL International has finalized the sunrise period for its important new OIM (Object Information Model), which includes the xBRL-JSON and xBRL-CSV standards. In turn, it has completed the software certification process. Any product awarded the XBRL Certified Software designation has been thoroughly tested by XBRL International for conformance with the current XBRL specifications.

OIM represents a years-long effort of the XBRL community to modernize the financial reporting standard, providing a model for easily transforming XBRL data between XML and other popular formats like CSV and JSON. This way, organizations can take advantage of the functionality of XBRL and at the same time have XBRL documents written in the format(s) most convenient for them.

Altova XMLSpy and RaptorXML Server were some of the very first tools on the market to support xBRL-JSON and xBRL-CSV and are now officially named XBRL Certified Software for the OIM standards (in addition to being certified for a variety of other core XBRL technologies).

Learn more:

Colleagues collaborating on computers in an office
Tags: , , , , ,

XML Reports to Text


Creating business reports from data stored in XML and relational databases is a common requirement in most organizations. However, it’s often complicated by the need to have information available in both web formats and print-ready formats such as PDF. Altova StyleVision takes a unique approach to report creation by letting users design reports from XML, databases, and even XBRL in a visual way – and output them in multiple formats simultaneously.

Over the years, support has been added for output to HTML, RTF, Word, and PDF – and now, based on customer feedback and requests, StyleVision also supports direct output to text. Let’s take a look at how it works.

Report designer
Read more…
Tags: , , , ,

Learn About OIM for XBRL


XBRL – the eXtensible Business Reporting Language – is a global framework for exchanging business information. The standard, maintained by XBRL International, is based on XML and designed to offer a standards-based approach to communicating and exchanging financial information between business systems.

The current version of the standard was finalized in 2003 and since then has received widespread uptake and eventual mandates from numerous countries and regulatory agencies, including the United States SEC. Adoption of the standard is due to advantages that include enabling automation and cost savings, better quality of reported data, improved analysis, and better quality of information used for decision making.

Despite its benefits, the complexity of XBRL presents a sharp learning curve for accountants and other stakeholders not familiar with XML, leading to errors and increased consultancy costs. In addition, coinciding with the adoption of big data technologies, XBRL has been used to represent ever growing datasets, which can be resource intensive.

XBRL International has worked over the years to modernize and simplify the standard in response to those challenges, and the Open Information Model (OIM) is an exciting and innovative solution.

Accountants learning about OIM XBRL
Read more…
Tags: , , , , , ,

NoSQL Database Support and More in Version 2022


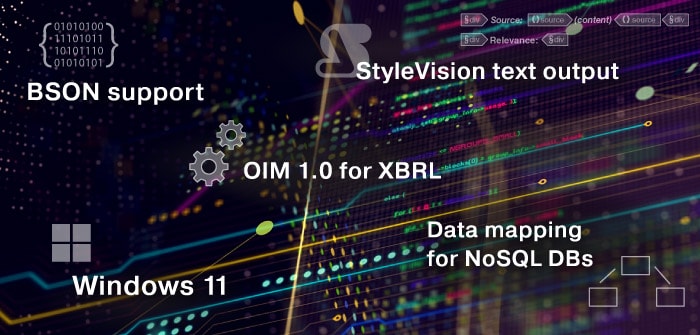
Altova Software Version 2022 is now available, with exciting new support for mapping and converting NoSQL databases in MapForce, pure text report output in StyleVision, and Windows 11 across the product line. The release also adds support for the exciting new OIM standard from XBRL International.

Here’s a look at the highlights.

Read more…
Tags: , , , , , ,

Finally – An Easy Way to Manage XBRL Taxonomies


XBRL – the eXtensible Business Language – makes use of taxonomies as a standards-based way to define the specific tags that are used for individual items of data (such as “net profit”) in a financial report, as well as their attributes and how they relate to other data points. As such, different taxonomies are created for different business reporting scenarios.

Over time a staggering number of different XBRL Taxonomies have been developed to reflect the local accounting practices in various countries. In addition, many specific industries, such as construction and insurance, have created their own specialized taxonomies.

Developers and financial pros working with XBRL software tools need a way to download and manage the XBRL Taxonomies they need for their specific projects. Altova has long provided free installers for these taxonomies and their various versions on our web site, but we’ve now made the process even more streamlined with the XBRL Taxonomy Manager.

Let’s take a look at how it works.

XBRL accountant
Read more…
Tags: ,

New tools for JSON, EDI, SWIFT, and XBRL in Version 2021


As standards-based technologies and their applications evolve, so does the functionality that users require from developer tools. In our latest release, we’ve added new ways to work with XBRL, JSON, EDI, and more that help Altova customers work faster and more efficiently.

Let’s take a look at some highlights from the Altova Software Version 2021 release.

Read more…
Tags: , , , , , , ,

XBRL Updates for COVID-19 Requirements


In response to measures related to the COVID-19 crisis, the European Banking Authority (EBA) has issued updated reporting and disclosure requirements. These are designed to accommodate, for instance, emergency legislation on pausing loan repayment schedules and the resulting impact on financial institutions.

As such, the corresponding local XBRL taxonomies for reporting to the EBA have been updated with these temporary changes.  Altova has published updated taxonomy installers that provide the most recent versions.

Updated taxonomies are included with any installation of the Altova EBA XBRL Add-in for Excel, and additional local taxonomies including BBK, BDP, NBB, and SRB are available on the product download page.

Additionally, the XBRL Taxonomies Installer for all other Altova products that provide XBRL functionality, including XMLSpy, MapForce, and StyleVision, has been likewise updated. 

Tags: , , , ,

New Tools to Work with XBRL in Excel


With the importance of accurate, standardized financial reporting enforced through XBRL filing mandates, having XBRL tools you can rely on is a must. What’s more, financial professionals need to be able to generate XBRL reports easily without getting bogged down by the complexities of XBRL syntax.

Altova offers several add-ins for Excel that make it easy for organizations to comply with regulations from the EBA, EIOPA, and other regulatory bodies that mandate reporting in XBRL. These easy-to-use software products integrate directly into Excel so that users can create valid XBRL reports in an environment where they’re already comfortable working. And, the add-ins support importing existing XBRL reports to Excel for easy readability and analysis.

The latest release of the Altova XBRL Add-ins for Excel provides some important new features – let’s take a look.

New tools to work with XBRL data in Excel
Read more…
Tags: , , , ,

Version 2020 Revolutionizes JSON Editing


We’re introducing several exciting new tools for JSON development in Altova Software Version 2020, but there’s much more too. Support for the XULE XBRL standard, comparing CSV against database content, and updated database support are just a few of the new features introduced across the product line.

Let’s take a look at the highlights.

Altova Software v2020 announcement
Read more…
Tags: , , , ,

Job Distribution on FlowForce Server


FlowForce Server is Altova’s high-performance engine for automating workflows of XML processing, data integration, report generation, and more. It integrates with other Altova server software products to automate their functions, such as executing complex data integration processes, including ETL projects, designed in MapForce; running  StyleVision report generation jobs; or validating XML, XBRL, or JSON files with RaptorXML Server.

Starting with Version 2019, FlowForce Server offers new options for distributed execution and load balancing to improve availability and performance. Let’s take a look at how configuring multiple FlowForce Servers to run as a cluster can help improve data throughput and provide redundancy.

Job distribution for high availability on FlowForce Server

Read more…

Tags: , , , ,

Solvency II XBRL without the Headache


Solvency II regulations in the European Union require periodic reports to be submitted in XBRL format by companies in the insurance industry. This can present a considerable challenge to workers unfamiliar with technical XBRL syntax.

Altova created an easy way to take data directly from Excel to generate reports based on the Solvency II XBRL taxonomy, completely shielding end users from the complexity of XBRL syntax.

Let’s take a look at what the Solvency II regulations mean to impacted companies and how the Altova Solvency II add-in for Excel makes it easy to generate valid reports for filing.

Learn about Solvency II XBRL

Read more…

Tags: , , ,

The Importance of Choosing Certified XBRL Tools 


Aside from complying with filing regulations, there are numerous benefits associated with adoption of the eXtensible Business Reporting Language. Standardizing information allows data validation as well as simplified comparison of reported data within an organization – from quarter to quarter or year to year, for instance – as well as comparing performance among multiple companies.

Of course, the benefits promised by XBRL  can only be realized through strict standards conformance in the tools organizations use for validating, reporting, and analyzing their XBRL data. Problems have arisen due to lack of consistent interoperability between software tools as well as less stringent validation checks that result in filing errors and diminished data quality.

Altova has always striven to deliver the closest possible conformance with supported XBRL standards and is honored to have received certification from multiple XBRL standards bodies, ensuring conformance and interoperability. Let’s take a look at the specifics and why this is so important for customers.

Financial pros using XBRL

Read more…

Tags: , , ,

Learn About Inline XBRL and XBRL Taxonomy Packages


As adoption of the eXtensible Business Reporting Language (XBRL) for financial reporting increases worldwide, new standards are emerging to meet the needs of filing companies and developers alike. Altova’s line of XBRL-enabled products supports a wide-range of XBRL standards and is updated frequently as new specifications emerge.

Let’s take a closer look at two of the newer XBRL standards – Inline XBRL and XBRL Taxonomy Packages – and explore how they work.

Corporate buildings

Read more…

Tags: , ,

Big Data, Database, and XBRL Tools Get a Huge Boost


It’s time for the latest release of Altova’s MissionKit and server software products, and this one delivers a huge boost in functionality for working with big data, databases, XBRL, and much more.

With support for Apache Avro in multiple products, additional databases and drivers across the product line, and two new XBRL specifications in developer and server products, plus a new way to build and process PDF forms, Version 2017 connects all the data dots.

What will be your favorite new feature? Let’s take a look.

Big Data Support

Read more…

Tags: , , , , , , , ,

Top Five Reasons to Document Your Schemas


Schema development is often an iterative process, and developers don’t typically start from scratch – XML Schemas, and, increasingly, JSON Schemas, are pieced together from existing documents or inherited from other teams. The ability to discern how schema components relate and analyze notes about development choices is infinitely helpful – but so often impossible due to lack of effective documentation.

Let’s take a look at some of the reasons documentation should be an integral part of your XSD, JSON, or other schema development.

 Benefits of XSD documentation

Read more…

Tags: , , ,

Excel Add-in Generates XBRL WIP Data


The reach of the eXtensible Business Reporting Language (XBRL) is rapidly expanding beyond financial reporting requirements to provide the advantages of standardized data submission across verticals. One recent development is the Work in Process XBRL Taxonomy created by XBRL.US for the surety industry.

The good news is that non-technical stakeholders can be completely shielded from the complexity of XBRL using software tools developed in concert with the taxonomy standards.

We’re excited to introduce the Altova Work in Process (WIP) XBRL add-in for Excel: a new product that lets contractors build their WIP reports directly in Excel, where they’re already comfortable working, and then export the reports in WIP XBRL for submission to sureties and underwriters.

Contractors writing WIP XBRL reports in Excel

Read more…

Tags: , ,

XBRL Data Mapping: WIP Taxonomy


The usefulness of the XBRL standard reaches far beyond SEC requirements for filing financial statements. Organizations such as XBRL.US and XBRL International are working to develop XBRL taxonomies and accompanying software solutions for countless other practical applications where standardizing data submission results in increased accuracy and productivity for all involved – for report filing, data analysis, and beyond.

One such project is the Work in Progress (WIP) Taxonomy created by XBRL.US for the surety industry. The new taxonomy helps save time and increase accuracy for report submission, and at the same time enables new opportunities for data analysis and decision making.

Construction-site-surety

Read more…

Tags: , ,

New RaptorXML scripts added: XBRL.US DQC Rules, EFM v35, and EBA Filing Rules


Altova is a member of XBRL.US and has recently joined the XBRL US Center for Data Quality to support the Data Quality Committee’s initiative to address the public’s concerns about the quality and usability of XBRL financial data filed with the SEC.

As such, we are pleased to announce that we have just released a new set of EDGAR Tools for RaptorXML+XBRL Server on GitHub. These new Python scripts for RaptorXML+XBRL Server now support validation against the new Edgar Filer Manual (EFM) version 35, as well as implementing all the Approved DQC Guidance and Validation Rules from XBRL.US.

Data Quality DQC

Read more…

Tags: , , , , , , , ,

XBRL Data Quality of SEC Filings in EDGAR


For fundamental investors probably the most important financial information to study are the financial reports from companies that they wish to potentially invest in. For publicly traded companies in the US, the SEC regulates what data needs to be reported and at which frequency, and investors typically access those financial reports through their own brokerage firm’s website, or through publicly available databases from other Internet providers. In addition, all the original filings from all companies are also directly available from the SEC in the EDGAR database. In addition to HTML and PDF versions of those financial reports, the EDGAR database also contains XBRL versions of those company filings since 2007, with the intent of making this data more easily comparable and directly consumable by computer programs for further analysis.

At least that is the goal…

In this article we’re going to look at some issues with the XBRL data quality of company filings in the SEC’s EDGAR database and show the surprising lack of correlation of high-level financial data extracted from the XBRL filings with publicly available financial data about US companies provided, e.g., by Yahoo Finance, Google Finance, and Fidelity Investments, as well as the shocking discrepancies found in the data reported by those separate services amongst one another.

Edgar_Validation

Read more…

Tags: , , , , ,

XBRL Example Files on GitHub


Did you know that Altova has a sample source code repository on GitHub? We are building this out based on customer requests, and at the moment we’ve posted a collection of XBRL example files, code snippets, and Python scripts for working with XBRL data, including instructions for accessing and processing the vast amount of data from filing companies available on the SEC web site, as well as some essential tools for performing validation on EDGAR filing data.

Here are some details on what you can find there.

hallway

Read more…

Tags: , , , ,

Foolproof, Fast, and Flexible XML Validation Options


The most recent few releases of XMLSpy included some pretty powerful speed increases for validations jobs, achieved by strengthening synergy between Altova products. Now, developers using XMLSpy can take advantage of RaptorXML Servers installed on their network for the processing of large or complex XML, XBRL, and project-based validation jobs – directly inside the XML editor.

raptorxml

The XML validator in XMLSpy is powered by the Altova RaptorXML validation engine, which already provides the closest possible standards conformance coupled with fast validation speeds. However, the validation rates achieved are still limited to single-core execution on the CPU available in the developer’s machine.  RaptorXML Server, on the other hand, benefits from the substantial increase in processing power afforded by multi-CPU, multi-core servers for increased throughput and more efficient memory utilization.

What does this mean for you? Let’s take a look at some of the advantages of connecting XMLSpy to RaptorXML Server.
Read more…

Tags: , , , ,

XML Validation Speeds Reach New Levels


Let’s take a look at a few of the features recently added to the Altova MissionKit desktop developer tools and complete line of server software products, including screaming-fast XML validation speeds using RaptorXML Server inside XMLSpy,  frequently requested functionality for EDGAR filing validation, support for SQLite databases and the TRADACOMS EDI format, and much more. You can always learn about the latest and greatest new features on the Altova What’s New page.


KS110642_700x335
Read more…

Tags: , , , , , , , , , ,

Rendering XBRL Table Linkbases using StyleVision


StyleVision provides the ability to quickly and easily generate multichannel renderings and reports of XBRL data. Because it employs a visual, drag-and-drop design model and includes numerous XBRL-formatting wizards, even stakeholders without deep technical XBRL expertise can leverage the full power of standards-based XBRL data to generate rich business reports on a one-time or recurring basis.  Starting with Version 2015 Release 3, StyleVision provides built-in support for rendering data according to XBRL Table Linkbase definitions. Let’s take a look at how it works.


Read more…

Tags: , , , ,

New Support for XPath/XQuery 3.1, WS-Security, and More Debut in R3


Release 3 of the Version 2015 Altova MissionKit desktop developer tools and Altova server software products is now available with updated standards support, customer requested features, and innovative new functionality that will save you time on everything from XPath and XQuery development, to advanced data mapping, to XBRL report rendering and beyond. You can skip right to the good stuff and upgrade now, or click Read More below for all the details.
clip_image005

Read more…

Tags: , , , , , , , , , , ,

2014 XBRL International Conference


Altova will be
exhibiting and presenting at this year’s 2014 XBRL International Conference in
Orlando, FL June 9 – 11th. We hope to see you at the event. Don’t
forget to stop by our booth to speak to us about how RaptorXML +XBRL Server can
speed up XBRL validation processes in your organization.  We’ll also be demoing the Altova MissionKit XBRL development and data
integration products
.
You can also sit in on the sessions where our CEO Alexander
Falk will be speaking
about problems and potential solutions in processing
large instance documents for both government and business implementations, as
well as a technical demonstration about extracting useful data from the SCC’s
RSS feed.  

We hope to see you there! 

New XBRL Tools for Compliance and Beyond


It can be hard to keep up with all the exciting developments in the XBRL space. Standards are constantly evolving to make compliance easier and deepen the benefits provided by XBRL for internal analysis and reporting. As a leader in XBRL development and validation, Altova is committed to supporting the latest standards, coupling strict conformance with high-performance, easy to use tools. With the latest product launch, Version 2014 Release 2, we’ve added some important enhancements, including significant increases in validation speeds, XBRL Table Linkbase support, and extended XBRL Formula tools. Below is a portion of an XBRL Table generated in XMLSpy, using XBRL Table Linkbase to render revenue calculations in new and productive ways:

XBRL Table

Let’s take a look at the benefits of these new features for your XBRL implementation.

Read more…

Tags: , , , ,

Altova’s Latest Release Sets the Performance Bar Even Higher


Release 2 of Altova MissionKit desktop developer and server software products is now available for downloading. This release packs a punch, delivering enhancements that boost performance by two or even three times, as well as updated standards support – and a revolutionary new approach to speeding up XSLT execution called XSL Speed Optimizer.


Altova Software Version 2014r2

Let’s take a look at some of these new features in depth.

Read more…

Tags: , , , , , ,

XBRL US National Conference in Las Vegas


clip_image002If you will be in Las Vegas next week for the 5th annual XBRL US National conference, be sure to check out the XBRL Data Forum for IT Pros & Developers. Altova is sponsoring this one day workshop that is part of the conference which consists of an intensive, practical day of discussion and presentation on XBRL dclip_image004ata, databases and opportunities for IT professionals interested in expanding their technical knowledge in the growing area of XBRL.

Along with RaptorXML + XBRL, the newest addition to our product family, Altova has a number of tools for processing and validating XBRL data such as XMLSpy, MapForce and StyleVision.


Tags: , , , , , , , ,

XBRL Validation and Processing Tools


When we were designing RaptorXML Server, we knew from the get-go that the engine should support XML and XBRL standards. The former standard is ubiquitous and the latter will be, as well, given increasing mandates from governments worldwide as well as adoption by enterprises for analyzing financial data in a standards-based, cost-effective manner. However, we knew that at this time a sub-set of customers would be interested in the XBRL capabilities of the engine, so we created two versions: RaptorXML Server and RaptorXML+XBRL Server.

clip_image002

Let’s take a look at some of the powerful XBRL-oriented features in RaptorXML+XBRL Server.
Read more…

Tags: , , ,

RaptorXML is here!


Altova RaptorXMLWe are thrilled to announce general availability of RaptorXML®, Altova’s third-generation XML and XBRL processing engine, for download and purchase.
Named for the dinosaur famous for its incredible speed and agility, RaptorXML provides blazing-fast validation and processing of XML, XSLT, XQuery, and XBRL data. Because it’s optimized for parallel computing on multi-core, multi-CPU machines, RaptorXML can scale quickly based on the amount of data you need to process.

Interface Options

In addition to numerous hyper-performance features and strict standards conformance, RaptorXML offers flexible implementation options for developers. These include command line operations, Java and COM APIs, a Python interface, and a built-in HTTP server. The built-in HTTP server allows RaptorXML to be integrated into SOA infrastructures and accept validation jobs, XSLT transformation jobs, etc., submitted via HTTP by other services or client applications.

Workflow Integration

RaptorXML may also be run as a component of Altova FlowForce Server, which provides a user-friendly Web interface for managing workflows based on customizable time or event triggers. This way you can automate validation or XSLT processing jobs based on a variety of triggers, or even pipeline RaptorXML jobs into multi-step processes utilizing MapForce Server and StyleVision Server that start with data aggregation, validation, and conversion and end with multi-channel report generation. The possibilities are many.

Product Options

There are two versions of RaptorXML available:

– RaptorXML Server supports validation and processing of: XML 1.0 & 1.1, XInclude 1.0, Xlink 1.0, XML Schema 1.0 & 1.1, XPath 1.0, 2.0 & 3.0, XSLT 1.0, 2.0 & 3.0 (subset), XQuery 1.0 & 3.0, and more.

– RaptorXML+XBRL Server supports all the features of RaptorXML Server, with the addition of processing and validating the XBRL family of standards: XBRL 2.1, XBRL Dimensions, XBRL Formula 1.0, XBRL Functions, and XBRL Definition Links.

A note to current customers of AltovaXML Reporting Edition: As Altova’s third generation XML processing engine, RaptorXML Server replaces AltovaXML, which is being discontinued. To help existing AltovaXML Reporting Edition customers transition to the new engine and get the full value from their Support and Maintenance Package (SMP), Altova is offering all AltovaXML Reporting Edition customers with current SMP an additional license for RaptorXML Server for the remaining duration of their SMP at no cost. In fact, the value of this new RaptorXML license is significantly higher than the list price of AltovaXML. The RaptorXML Server license is for four cores and can be used in addition to the AltovaXML Reporting Edition license you currently have. To upgrade visit this page.

Free Trial


RaptorXML: XML and XBRL processor RaptorXML Server and RaptorXML+XBRL Server are available for Windows, Linux, and Mac OS, and you can download a free trial for your preferred OS.

Tags: , ,

Announcing RaptorXML, the Hyper-fast XML and XBRL Server


  clip_image001We are very excited to be at the XBRL 26 Conference in Dublin, Ireland today to announce a brand new server product in the Altova family of XML and XBRL tools! Altova RaptorXML is a hyper-fast XML and XBRL validation and processing server. It’s Altova’s third-generation XML and XBRL engine, built completely from scratch to help organizations efficiently validate, process, transform, and query the vast and ever-increasing amounts XML and XBRL data being generated as a result of XBRL compliance regulations and myriad other big data trends. RaptorXML is written to be highly scalable for today’s multi-CPU and multi- core computers and servers. This, along with high performance code optimizations and an extremely low memory footprint, has helped make RaptorXML a lightning-fast XML and XBRL server that can meet the demands of today’s data processing applications. Simply put: we architected RaptorXML to combine the performance benefits afforded by modern parallel computing environments with strict compliance to the latest versions of all relevant XML and XBRL standards. RaptorXML includes support for the very latest versions of all relevant standards and has been submitted to rigorous regression and conformance testing. The server will be available in two versions, both of which are available for Windows, Linux, and MacOS platforms. RaptorXML Server supports validation and processing of:

  • XML 1.0 & 1.1
  • XInclude 1.0
  • Xlink 1.0
  • XML Schema 1.0 & 1.1
  • XPath 1.0, 2.0 & 3.0
  • XSLT 1.0, 2.0 & 3.0 (subset)
  • XQuery 1.0 & 3.0
  • And more

RaptorXML+XBRL Server supports all the features of RaptorXML Server, with the addition of processing and validating the XBRL family of standards:

  • XBRL 2.1
  • XBRL Dimensions
  • XBRL Formula 1.0
  • XBRL Functions
  • XBRL Definition Links

Developers creating solutions using Altova MissionKit XML development and XBRL development tools will be able to power their server applications with RaptorXML for hyper-performance, increased throughput, and efficient memory utilization, giving them the opportunity to validate and process large amounts of XML or XBRL data cost-effectively.  Check out the complete list of supported XML and XBRL standards and more details on this groundbreaking new server product. RaptorXML will be available to download and purchase in May. clip_image003

Tags: , , , , , ,

New Case Study: Automating XBRL Data Collection and Processing


Case studies are a great way to see how other organizations use Altova® technologies to develop unique projects that meet their business goals. We’re often asked, however, what comes next. Did the project take off? Has it grown since the case study was published?

We’re happy to bring you a follow up to a case study we published last year about the not-for-profit Maryland Association of Certified Public Accountants (MACPA).
In the original case study, MACPA converted General Ledger and other financial data from siloed systems into XBRL – in house and on a budget – with the Altova MissionKit®. At that point, they were mapping the XBRL file to multiple external targets, including an Excel spreadsheet used to feed their Key Performance Indicators (KPI) system. (You can read the original XBRL case study here.)

Since that time, they’ve built on the foundation they created and developed a business intelligence dashboard driven by the XBRL files they generate in MapForce®. They used Altova FlowForce®, an application designed to automate the execution of MapForce data transformations and other tasks on servers, virtual machines, and workstations, to automate the XBRL data collection and processing. Now the most recent data is available across the entire organization for custom reporting.

You can read the follow-up to the original XBRL case study here.

clip_image001

Read more about how they did it. Read more…

Tags: ,

Case Study: Altova Customer Succeeds with XBRL


XBRL is mandated for most public companies. So why are private organizations and non-profits jumping on the bandwagon? This case study examines a real-world success story. clip_image002   We were really excited when the folks at MACPA told us about their success working with XBRL. They set out to discover if XBRL could be used successfully (without a huge upfront investment) by small businesses and NPOs and ended up confirming not only that, but realizing benefits to their internal financial processes, as well.

Toward Ubiquitous XBRL

With close to 10,000 members, the Maryland Association of Certified Public Accountants (MACPA) is often looked to for their expertise on issues relevant to the field of accounting. The US Securities and Exchange Commission’s (SEC) mandate that public companies submit financial data in XBRL is one of those issues. Despite the potential of XBRL for reducing costs and increasing efficiency, many organizations are concerned about the time and expense that will be required to convert all of their financial data into XBRL, a process that can be further complicated when financial data is housed in multiple systems. MACPA set out to prove that these obstacles are easily surmountable: with the right tools, it’s possible to bring XBRL transformation in-house to not only comply with mandates, but realize greater efficiencies and transparency in various scenarios. In the process they discovered that tagging data in XBRL is valuable to private entities and non-profits as well as public companies facing a mandate. They took advantage of widely available XBRL software tools including the Altova MissionKit, which interfaces with multiple relational databases for XBRL mapping, tagging, and reporting.   clip_image003   In the end, the project turned MACPA’s financial data into a force for driving efficiencies and accountability. Once their internal accounting data was mapped to XBRL, they were able to automate burdensome data collection, transformation, and analysis tasks to gain more insight into their financial data. For instance, MACPA used their XBRL data to populate their financial Key Performance Indicator (KPI) system, significantly reducing the amount of time and effort required to prepare the KPI documentation. This in turn enables them to run the system at more frequent intervals. They are also now able to automate previously onerous tax filing tasks by mapping the association’s financial data in XBRL to the 990 tax return. (With almost 1.5 million exempt organizations in the US filing hundreds of thousands of Form 990s each year, the efficiency gained by using XBRL could be significant.)

“Ubiquitous XBRL could do for accounting/taxation what barcodes did for retail.” – Skip Falatko, MACPA Director of Finance and Administration

This project not only enabled MACPA to learn about XBRL and advise their members, but also to automate and enhance the way they dealt with their own financial data. And utilizing affordable tools like the Altova MissionKit confirmed that handling XBRL in-house is the way to go.

“Why outsource tagging [your data in XBRL]? If you tag it in house, then you own the data and can use it in myriad different ways as a productivity tool.” – Tom Hood, MACPA CEO and Executive Director  

Check out the complete case study to learn how MACPA brought XBRL transformation in-house to effect changes in efficiency and transparency. If you’re an accounting or technical professional who needs to learn more about XBRL, Altova offers free, self-paced online training and an educational XBRL whitepaper.

Tags: , , ,

Leverage Your Financial Data with the XBRL Chart Wizard–Part 2


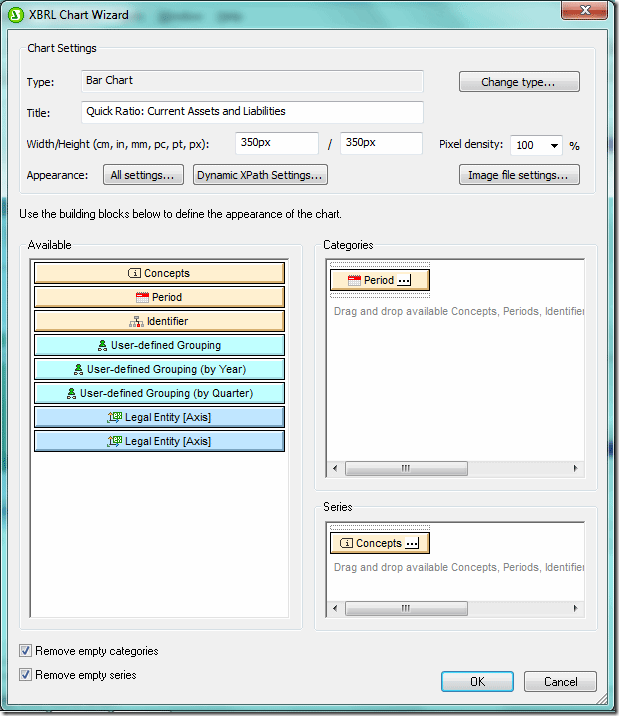
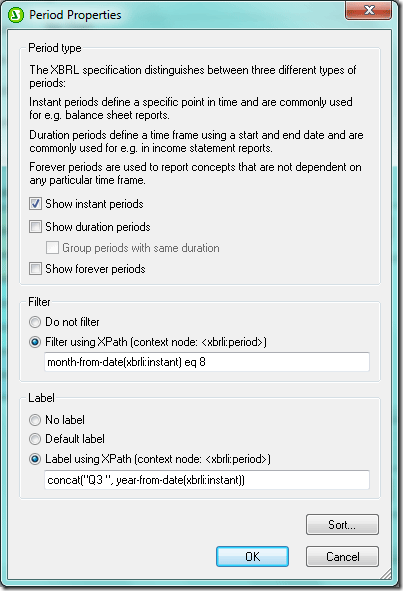
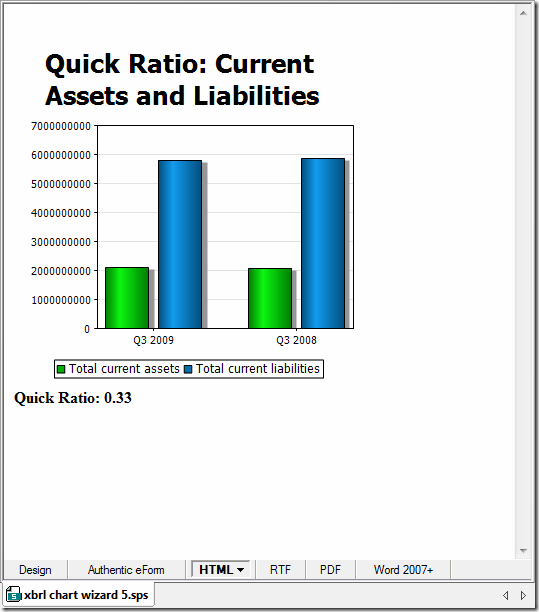
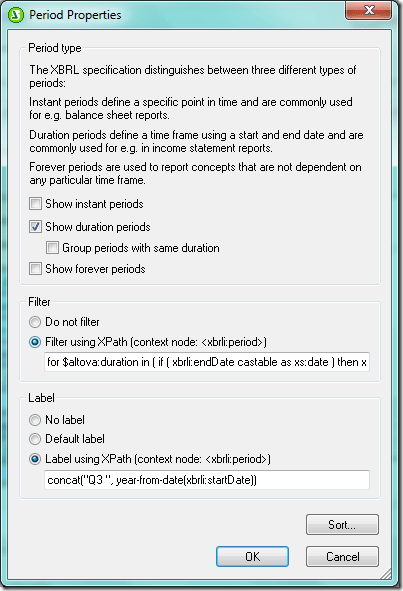
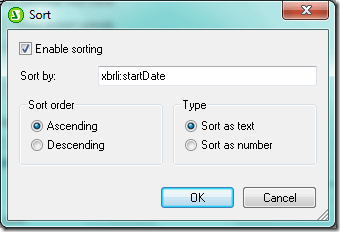
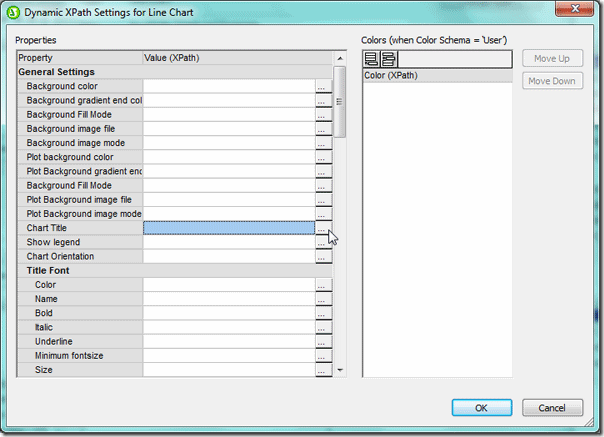
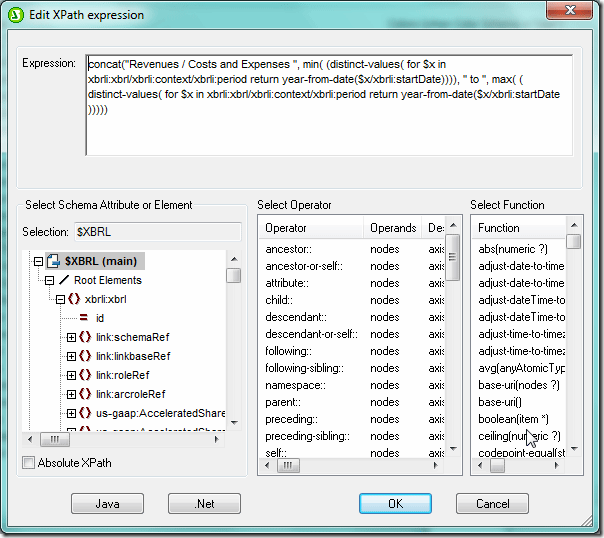
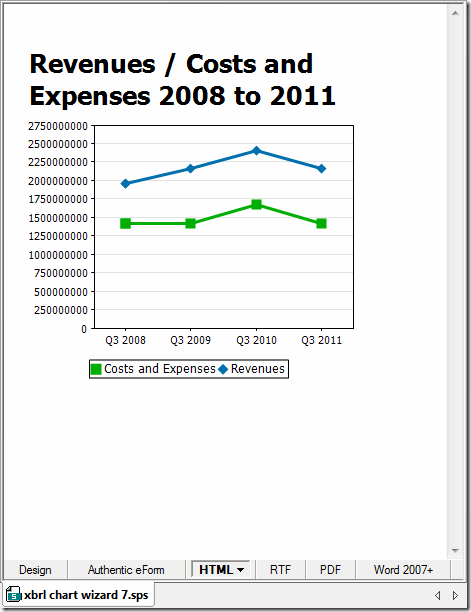
Extensible Business Reporting Language (XBRL) is an XML-based language for reporting and exchanging financial data that’s making inroads across the globe. In fact the US Securities and Exchange Commission now requires public companies to submit financial data in XBRL format.Altova’s MissionKit, a suite of our most popular software, supports XBRL tagging via XMLSpy and MapForce as well as XBRL rendering via StyleVision. With StyleVision you can create sophisticated financial reports including charts and tables based on XBRL instance files. image This is the second post in our two part series on StyleVision’s XBRL chart capabilities. In our last post we showed you how to call the XBRL Chart Wizard and create pie charts. This time we’ll show you how to create bar charts and line charts. Bar Charts Bar charts are the ideal vehicle for comparing groups of objects or visualizing change from one period to another. Here we’ve used the XBRL Chart Wizard to create a bar chart comparing Current Assets to Current Liabilities from the third quarters of two consecutive years. After invoking the XBRL Chart Wizard as we did in the very first step, we select Current Assets and Current Liabilities in the Concepts tab and place it in the Series pane so that these amounts will be reflected on the Y or vertical axis. clip_image001 Now we click the ellipses in the Period tab in the Categories pane to bring up the Period Properties dialog box. Assets and Liabilities are measured at specific points in time and so we have checked the Show instant periods box. We’ve also filtered the data using XPath so that only assets and liabilities at the end of the third quarter (which ends in August) appear. Finally we add a dynamic label that combines “Q3” with the year using XPath. clip_image002 In addition to the bar chart, we’d like to include the Quick Ratio, a measure that indicates whether an organization has enough readily liquidated resources to cover outstanding financial obligations. The Quick Ratio is simply Current Assets divided by Current Liabilities. We’ve added an auto calculation and used XPath to divide Current Assets by Current Liabilities for all time periods in the XBRL instance document. Below is the design view of our bar chart and auto calculation, including the XPath. clip_image003 The HTML output appears below. However we can also render the design in RTF, PDF, and Word 2007+. clip_image004 Line Charts A line chart has a line connecting discrete points plotted on a graph and is typically used to track how financial and other data varies over time. In this example we’ve created a line chart to track two concepts – costs / expenses and revenue – over a four year period. Just as we did for the pie chart and bar chart, we’ve dragged a concept (here, Revenues) from the Schema Tree into the design window and invoked the XBRL Chart Wizard. Likewise, once the Chart Wizard opens, we clicked on the ellipses on the Concepts tab in the Series pane to bring up the Concept Properties dialog box, where we selected the Costs and Expenses concept. Costs and Expenses will now appear on the chart along with Revenues. Our XBRL file includes both instance and duration time periods so in the Period Properties dialog box below (invoked by clicking on the ellipses in the Period tab in the Categories pane) we’ve selected only duration periods, or those with a start and end date. We will now use XPath to filter the data. We’ll create a variable $altova:duration that translates the difference in number of days between the start and end dates of the period into the number of months and then selected data where that variable is equal to three (equivalent to a fiscal quarter). We’ve also used XPath to create a dynamic label combining Q3 with the year. clip_image005 Because our line chart is visualizing changes in revenue and costs and expenses over time, we have used the Sort function in the Period Properties dialog box above so that the data appear chronologically. clip_image006 Although the appearance of the chart (e.g., colors, labels, and visibility of tick marks and axis values) can be controlled with the All Settings button in the Chart Settings section of the XBRL Chart Wizard dialog box, it can also be controlled with XPath via the Dynamic XPath Settings button under Chart Settings (below). clip_image007 This feature provides tremendous flexibility not only in managing appearance but in managing the contents of the chart. Among the many things you can do with XPath are controlling output based on conditions and adding a dynamic title that includes the time period reflected as we’ve done here. Once you click the Dynamic XPath Settings button in the XBRL Chart Wizard dialog box (above), the Dynamic XPath Settings dialog box is invoked (below). clip_image008 Clicking the ellipses next to the property that you want to edit in the Dynamic XPath Settings dialog box (above) brings up the Edit XPath Expression dialog box (below). Here we’ve used XPath to concatenate a string (“Revenues / Costs and Expenses”) with the first and last years in the period we identified in the Period Properties dialog box earlier. clip_image009 The XPath expression entered here will overrule the settings in the Change Appearance and XBRL Chart Wizard dialog boxes – notice in the chart (here rendered in HTML) includes the dynamic title that we built with XPath rather than the title in the XBRL Chart Wizard Dialog Box. clip_image010 As we’ve shown here, the XBRL Chart Wizard provides developers and designers with a highly flexible tool for visualizing XBRL data. With XBRL’s place in the international technology sector firmly established, the ability to leverage XBRL data to support strategic decision making is key. There are a number of different types of companies that are discovering the strategic value of XBRL. Our XBRL case study describes how the Maryland Association of CPAs streamlined their tax reporting and benchmarking processes with XBRL. This case study is a great resource for anyone interested in learning how to leverage this data with Altova software tools.

clip_image011

Have you created something really great with the XBRL Chart Wizard? Or developed an interesting project using StyleVision or another of our tools? Please share your story with other Altova users by commenting on this blog post. Think it would make a great case study? Email us at marketing@altova.com – if we choose to use your story you’ll receive a $200 Amazon gift card as well as some free press for you and your organization. We’d love to hear from you!

Tags: , , ,

Leverage Your Financial Data with the XBRL Chart Wizard–Part 1


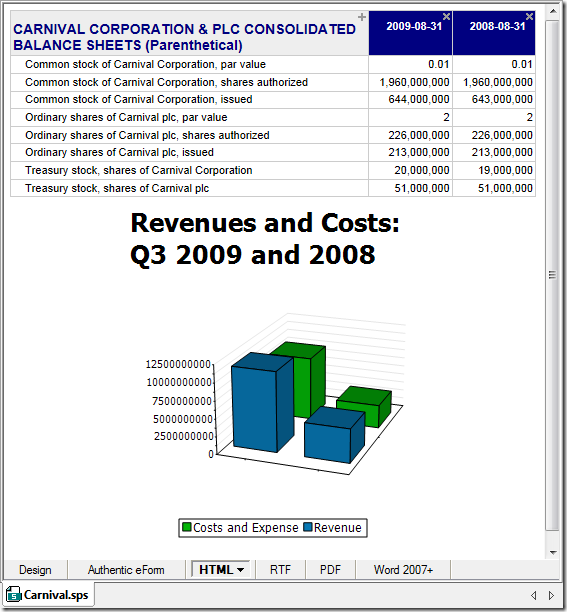
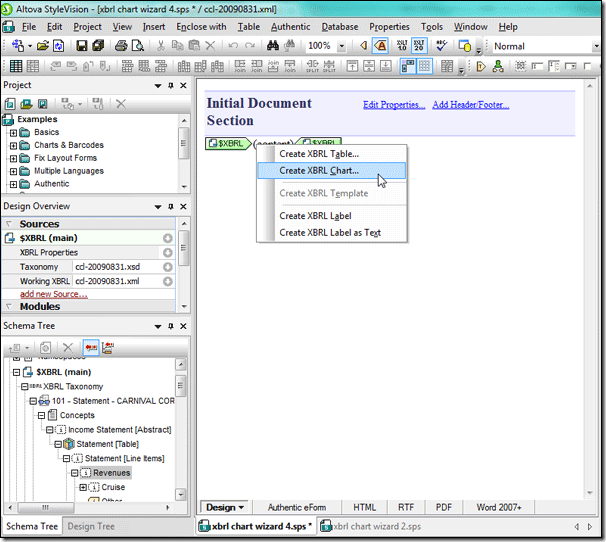
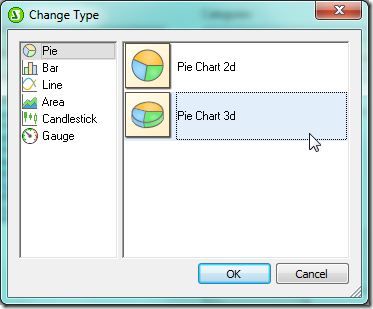
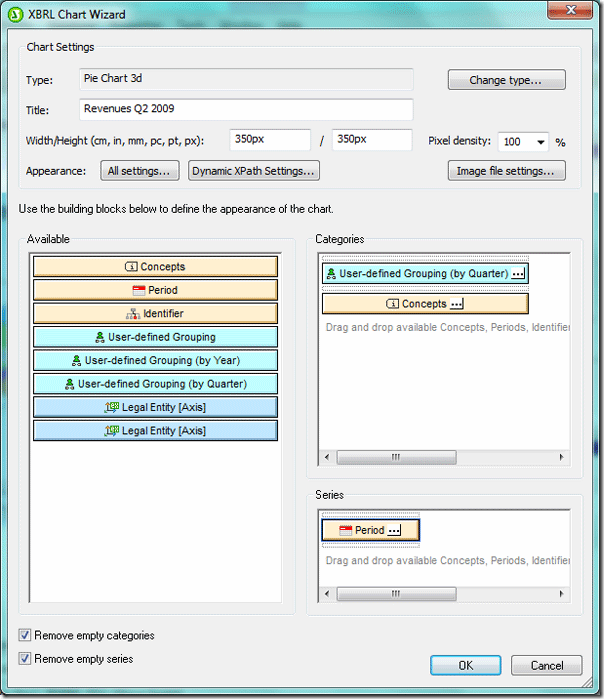
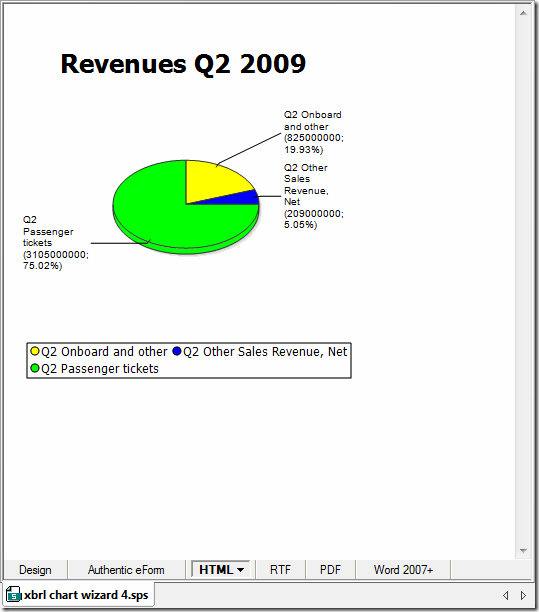
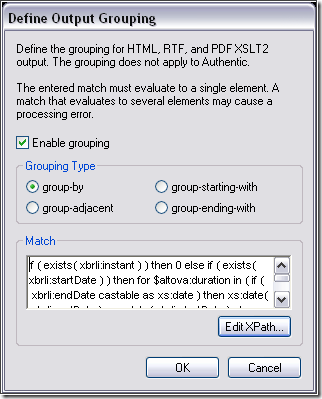
Extensible Business Reporting Language (XBRL), an XML-based language for financial data, is increasingly being used by both public and private organizations across the globe – in fact it is mandated for some companies in countries including the United Kingdom and the United States. Altova provides comprehensive support for XBRL tagging and XBRL reporting with the MissionKit, a suite of our most popular software. Among the MissionKit tools is StyleVision, a graphical stylesheet designer and report builder, which can be used to support a host of internal reporting and analysis activities for companies that use XBRL. clip_image001 In the next post we’ll focus on StyleVision’s XBRL Chart Wizard, a powerful XBRL visualization tool that can turn your XBRL-tagged financial data into powerful charts and graphs – if a picture is worth 1,000 words then StyleVision is worth its weight in gold. Calling the XBRL Chart Wizard You invoke the XBRL Chart Wizard as you do the XBRL Table Wizard and other StyleVision capabilities. Once you’ve started a design by selecting New – New from XBRL Taxonomy from the File menu and selected a taxonomy and working XBRL file, all concepts are populated to the Schema Tree. From here you simply select a concept from the XBRL taxonomy in the Schema Tree and drag it into the design window. For this example we’ll be using the Carnival Corporation quarterly report for 2009 that they have published with the SEC, but you can apply the same techniques to any XBRL instance document – be it a publicly available filing with the SEC or an internally generated XBRL file. As a first step, we will look at how the revenues are composed by creating a pie chart that shows the revenue breakdown. Here we’ve dragged the Revenues concept (highlighted in the Schema Tree in the left sidebar) into the design window and selected Create XBRL Chart.   clip_image003   Once you select Create XBRL Chart the XBRL Chart Wizard dialog box will open automatically.   clip_image004   Once you click the ellipses in the corner of the Concepts tab in the Series pane, the Concept Properties dialog box (below) will open and you can select concepts to appear in the chart. Carnival Corp breaks out revenues for their cruises between Passenger tickets and the Onboard and other. We will select those two concepts, and also the Other category to capture all elements that make up the total revenues.   clip_image005 Pie Charts Pie charts are useful when you wish to see the relative contribution of individual elements to the whole. Placing Onboard and other, Other Sales Revenue Net, and Passenger Tickets in a pie chart provides us with a visual representation of the relative contributions of each source of income to total revenue. We are now ready to make changes in the XBRL Chart Wizard dialog box so that our pie chart reflects the information we need in a format conducive to strategic decision making. First we must change the chart type under Chart Settings from Bar Chart to Pie Chart 3D via the Change type… button, which brings up the Change Type dialog box (below).   clip_image006   In pie charts, the concepts that will form the segments of the pie (in this instance the Onboard and other, Other Sales Revenue Net, and Passenger Tickets concepts that we selected above) are placed in the Categories pane and the values in the Series pane. Therefore we will need to move the Concepts tab to the Categories pane and the Period tab to the Series pane. We’d like to segment the revenue data from the XBRL file based on quarter. We do this by dragging the User-Defined Grouping (by Quarter) tab from the Available pane to the Categories pane. We’ll make the necessary changes in this tab in the next step. We will also check the Remove empty categories and Remove empty series boxes so that a value or label will not be generated if no data exists and change the size of the chart to 350 pixels x 350 pixels in the Chart Settings section of the XBRL Chart Wizard dialog box. After we make these changes, the dialog box looks like this:   clip_image007   Now we are ready to select the data that appears in the chart. First we’ll segment the data by quarter. We invoke the User-defined Grouping Properties dialog box pictured below by clicking the ellipses in the corner of the User-defined Grouping (by quarter) tab in the Categories pane. The grouping feature provides you with maximum flexibility by allowing you to segment data based on variables identified in the taxonomy (e.g., reporting period, geographical area, division). Now we can use XPath in the Group By field to group the data by quarter, filter it based on the group we created (in this example only the second quarters will appear in the chart), and add a dynamic label. We want the chart to reflect all second quarter data for each of the revenue concepts we selected so we toggle Do not filter under Group key filter.   clip_image008   We can further filter the data by clicking on the ellipses on the Period tab in the Series pane to bring up the Period Properties dialog box. Here we’ve selected only duration periods (i.e., those with a start date and end date – instant periods have a single date reflecting the date that the “snapshot” was taken) and filtered based on year. In this example only data from the second quarter of 2009 will appear in the chart.   clip_image009   Finally we can fine tune the chart’s appearance by clicking on the All Settings tab under Chart Settings, which brings up the Change Appearance dialog box. Here we’ve opted to show the concept labels, values, and percent of total. We can also select color schema, chart size, font types and sizes for each section of the chart (e.g., chart title, labels, legend), and background colors.   clip_image010   After making all of these changes we hit OK in the XBRL Chart Wizard dialog box and the pie chart reflecting these changes is created. Please note that after the chart is created you can go back and edit the chart settings.   clip_image011   As you can see, the biggest source of revenues is Passenger tickets, which produced 75.02% of total revenues for Carnival Corp in the second quarter of 2009. As is the case with all StyleVision designs, output can be rendered in HTML, RTF, PDF, and Word 2007+ formats and an XSLT stylesheet for each format is automatically generated. And this was just one example of what kind of data you can extract from an XBRL filing and visualize in a chart. Next week we’ll look at creating bar charts and line charts from XBRL financial data. clip_image022 Have you created something really great with the XBRL Chart Wizard? Or developed an interesting project using StyleVision or another of our tools? Please share your story with other Altova users by commenting on this blog post. Think it would make a great case study? Email us at marketing@altova.com – if we choose to use your story you’ll receive a $200 Amazon gift card as well as some free press for you and your organization. We’d love to hear from you!

Service Pack 1 Available


Just a quick note to let customers of Altova Software Version 2011 Release 3 know that Service Pack 1 (v2011r3 SP1) is now available for all Altova products. In addition to bug fixes, SP1 includes important enhancements:  

Support in all XBRL-enabled MissionKit tools for the 2011 US GAAP Financial Reporting Taxonomy. Support for this latest version adds to existing options for working with US GAAP 2009, US GAAP 1.0, and IFRS taxonomies in XMLSpy, MapForce, and StyleVision.

SP1 also provides Firefox® 5 compatibility in the Authentic Browser Plug-in, which adds to recently announced support for Firefox 4 and Internet Explorer® 9 in the WYSIWYG XML and database content editor.

  Please note that v2011r3 SP1 is a new product version (not a patch). All customers with a license for Altova Software v2011r3, as well as any customer with an active Support and Maintenance Package for their Altova product(s), can simply download and install this update.

Tags: ,

The Maryland Association of Certified Public Accountants (MACPA) transforms data to XBRL in-house


What is XBRL and how can it help your organization? Members of the Maryland Association of CPAs (MACPA) found out how using the interactive XBRL (Extensible Business Reporting Language) format can help not only larger, public companies, but also smaller, non-profit organizations like themselves.clip_image004 MACPA invested in the Altova MissionKit tool suite to support their XBRL project. Using our XMLSpy XML editor; MapForce, our graphical data mapping, conversion, and integration tool; and the StyleVision visual stylesheet and report design tool, MACPA was able develop a comprehensive system that employs XBRL data for a variety of reporting functions, both internal and external.
For example, MACPA used the generated instance document from MapForce to populate their financial Key Performance Indicator (KPI) system, significantly reducing the amount of time and effort required to prepare the KPI documentation. XMLSpy was used to extend the US-GAAP taxonomy to accommodate entries specific to MACPA. clip_image002 MapForce also came in handy for mapping the Global Ledger (GL) Taxonomy to the extended GAAP taxonomy. clip_image004 As a result, MACPA has increased its working knowledge of XBRL, automated previously burdensome data collection and transformation tasks, and have gained more insight into their financial data. To read more about how MACPA utilized the Altova MissionKit to convert all their financial data to XBRL and create a model for public and private business of any size to leverage the powers of XBRL, the latest case study from Altova is a must read! Do you have a story to tell about your use of Altova tools? If so, we want to hear from you. Case studies generate great publicity. Check out recent press coverage from the MACPA case study. Plus, if we choose to use your story you will receive a $200 Amazon gift card!

Tags: , , , , , , ,

StyleVision Supports XBRL for Financial Reporting Part I – Creating GAAP-Compliant Reports and StyleSheets with a Single Click


Did you know that StyleVision is also an XBRL rendering and reporting tool that will allow you to create GAAP-compliant financial reports with the click of a button ? image
In this post we’ll show you how …

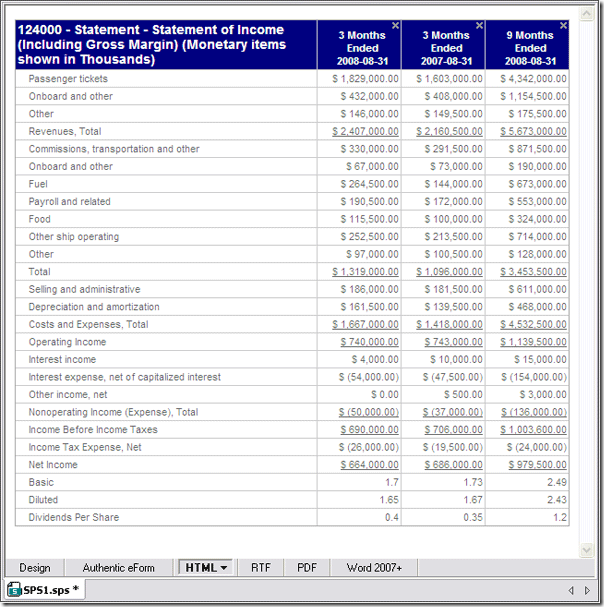
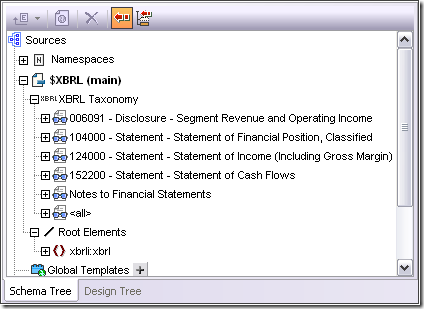
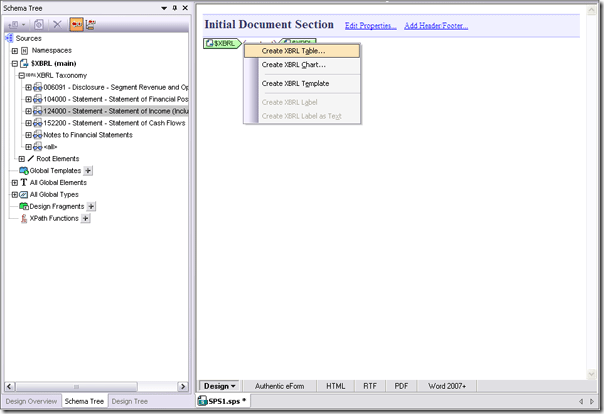
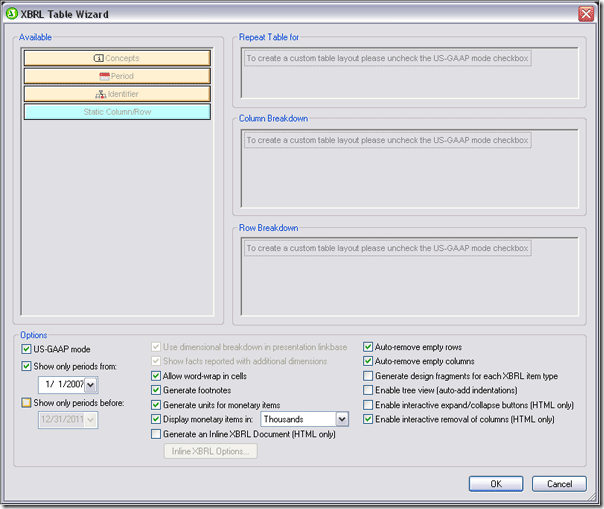
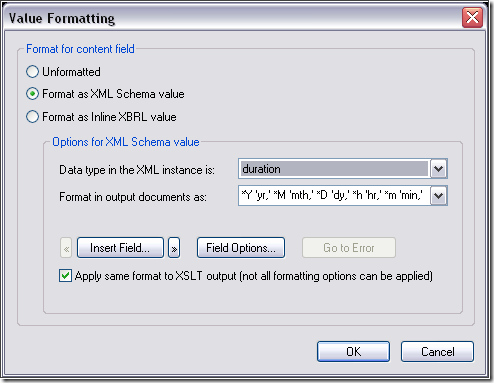
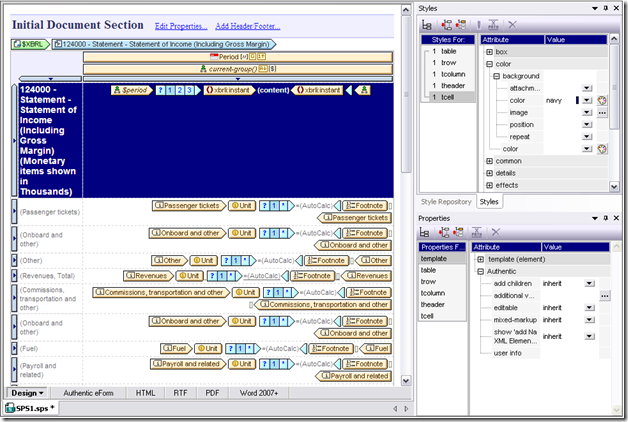
Altova’s native support for XBRL is great news for IT professionals serving a range of industries given the US Securities and Exchange Commission’s (SEC) formal embrace of XBRL as a financial reporting language. In fact, virtually all public companies using GAAP accounting will be required to submit financial data for fiscal periods ending on or after June 15, 2011 to the SEC in XBRL, an XML-based language. IT professionals will be called upon not only to facilitate the exchange of data but to render XBRL data in a manner intelligible to business users. StyleVision can help. With a number of built-in capabilities that allow you to create customized GAAP-compliant stylesheets and reports for XBRL data with only a few clicks, StyleVision can make you look like a technical – and accounting – whiz. When you create a new design from an XBRL taxonomy, StyleVision creates a schema tree that reflects the presentation linkbase, an XML file that includes sets of related concepts grouped under presentation links (e.g., in the example below, 006091- Disclosure – Segment Revenue and Operating Income is a presentation link). Typically the presentation linkbase will appear in the schema tree as discrete financial statements, addendums, disclosures, and the like (this will depend on the contents of the linkbase – and keep in mind that although standard not every XBRL taxonomy will have a linkbase). Individual root elements are also available for reporting/processing and appear below the presentation links. image To create a stylesheet or report, drag the appropriate presentation link into the design window (for this example we have selected 124000 – Statement – Statement of Income (Including Gross Margin)). You will be prompted to create an XBRL table, XBRL chart, or XBRL template. image Selecting Create an XBRL Table will invoke the XBRL Table Wizard. image Note that under Options we have US-GAAP mode checked. If you check the US-GAAP mode box StyleVision will generate a table with all of the financial data in the presentation link selected. (You can select which period you would like represented under the Options tab as well). Output in HTML, RTF, PDF, and Word 2007+ formats, plus corresponding stylesheets, are automatically generated once you click OK. Although there are a number of formatting options in the Table Wizard, once the table is generated you can make additional changes (e.g., background color, font, text, table borders, etc.). In the example below we highlighted the <xbrli:instant> element and used Value Formatting to change how the time periods are represented. In the XBRL instance document, the time period appears in YYYYY-MM-DD – YYYY-MM-DD format. We have changed it to [Number of] Months Ending YYYY-MM-DD. image Notice the Styles window in the screenshot below – we’ve also changed the table header’s background color to navy and the text color to white. image Sorting, grouping (via XPath), and filtering (via XPath) options can also be edited after the table is generated by the XBRL Table Wizard. Simply right click in the Period or current-group bar above the table header and select the appropriate function. The Group by … dialog box appears below. image The GAAP-compliant table rendered in HTML appears below. image The HTML output above reflects the formatting options we selected in the XBRL Chart Wizard:

  • As indicated in the header, monetary items are shown in thousands because we selected Thousands in Display monetary items in under Options
  • We checked Auto-remove empty rows and Auto-remove empty columns so there are no empty rows or columns
  • Because we selected Enable interactive removal of columns (HTML only) under Options in the XBRL Chart Wizard the end user can click the “x” in the corner of a column to hide it
  • We did not select Enable tree view so the labels are all left justified and do not reflect the hierarchy of the schema
  • We did not enable Interactive expand/collapse buttons so they do not appear

One last thing to note is that in our example we have selected the entire presentation link 124000 – Statement – Statement of Income (Including Gross Margin) and all data in that presentation link is populated to the table. However if you expand the presentation link in the schema tree you can select individual line items or those grouped together from a presentation link and create a mini-table. This is just an overview of how you can use StyleVision’s built-in GAAP-compliant functionality to render XBRL data in some simple ways – the possibilities for presenting this data are virtually limitless. In future posts we’ll discuss using the XBRL Table Wizard to combine multiple line items from different presentation links for highly customized data presentation, creating powerful charts with the XBRL Chart Wizard, and other ways to help organizations leverage their XBRL data (we’ll even provide an example of how XBRL financial data can be used with other data sources to create an annual report).

clip_image001

Have you used Altova tools to create XBRL solutions for your clients? Please share your story with other Altova users by commenting on this blog post. Think it would make a great case study? Email us at marketing@altova.com. We’d love to hear from you!

Tags: , ,

Altova XBRL Resources… just in time for XBRL US


With the XBRL US conference just around the corner, it’s high time to brush up on your knowledge. Fortunately, the Altova Web site has everything you need to learn the intricacies of XBRL vernacular, XBRL taxonomy structure, how XBRL relates to XML, XBRL reporting, and more. Altova XBRL Resources

  • Free online training – a five module course providing an introduction to XBRL and the Altova MissionKIt for beginners and advanced users
  • XBRL: An Overview for Technical Users (PDF 5.62 MB) – a whitepaper that gives developers and other technical users an overview of financial statements and how XBRL can be used not only to add transparency and interactivity to business reporting, but also to streamline enterprise accounting and reporting efficiency
  • XBRL glossary – if you are new to XBRL, trust me, you’ll need this
  • XBRL tools page – just a little page that will fill you in on exactly where the MissionKit fits in the realm of XBRL reporting and compliance
  • XBRL datasheet (PDF 806 KB) – the best we could do to fit everything on one page… and my, does it look pretty

So, check out these resources, download a free 30-day trial of the MissionKit, grab a cup of coffee, and start exploring XBRL today… and don’t forget to stop by our booth next week at XBRL US in Philly!

Tags: , , ,

Updated Industry Schema Library


“The nice thing about standards is that there are so many to choose from.” – Andrew S. Tanenbaum (attr.)

Maybe we can help. Altova’s updated schema library is a collection of over 100 industry and cross-industry XML Schema and DTD specifications – all in one central location. XML standards (and technology standards in general) are used to promote information sharing and interoperability across disparate software and systems. In a perfect world, this would translate to a global network of data being exchanged seamlessly between information partners… in a perfect world. However, there are some industries that are reaping the rewards of standardization, and hopefully these efforts will pave the way for more. Very recently we have seen an increased interest and even some actionable mandates in XBRL for financial data, HL7 for exchanging healthcare messages, and NIEM for inter-agency communication within the United States government. Of course, if you do find yourself working with some conflicting technology standards, you should probably take a look at Altova MapForce. With native support for visually mapping pretty much any data formats you can think of (XML, databases, flat files, EDI, Excel 2007+, XBRL, and Web services), easily adding data processing functions, and a whole bunch of automation options, you may even find that creating data integration solutions is well… kind of fun. Check out Altova’s Industry Schema Library, or download a free 30-day trial of MapForce today!

Tags: , , , , , ,

XML: The Power Behind XBRL


Just yesterday my new article, “Robust XML Technologies Provide an Ideal Foundation for XBRL”, was posted on the Data Interactive blog – an excellent place to get XBRL insights from financial data and technology experts. My hope here was to underline the fact that, even though it adds a very powerful semantic layer, XBRL is still based on XML. XML lends not only the convenience of extensibility, but opens the door to a whole family of technologies including XSLT, XQuery, XPath, and more. Many of our readers are familiar with all of the power and flexibility that these languages provide – and, in fact, the widespread popularity of XML technologies means that someone in your organization probably is too. Check out the full article at http://hitachidatainteractive.com/ and let your XML developers take your data out for a test drive.

Tags: ,

Altova XBRL Resources


In the year since the Altova MissionKit 2009 added XBRL support as a marquee feature, we have added several new technical resources for anyone starting to learn the complexities of XBRL. Many of these are uniquely focused toward our present and future customers – those who are familiar with XML and the other components that contribute to the XBRL standard, but have no hands-on experience with XBRL itself. We invite you to comb through these resources and to learn, as we have learned, how this powerful and flexible language can promote transparency and interactivity in financial reports, transactions, and internal auditing practices. · XBRL: An Overview for Technical Users – a whitepaper catered toward developers and other technical users · XBRL Training – a free, online, 5-module course that provides an introduction to XBRL technology and the MissionKit · XBRL Glossary – a comprehensive list of the technical terms that are used in describing XBRL instance documents, XBRL taxonomies, and the XBRL specification in general · XBRL Solutions Pagea brief overview of the XBRL specification and the Altova tools that support it Snap2

Tags: , , ,

Altova at Microsoft PDC


clip_image001The Altova road trip continues as we head west to Microsoft PDC in Los Angeles from November 17-19 at the Los Angeles Convention Center. If you’ll be attending PDC, make sure to stop by and meet with the Altova team at booth 517. We’ll be demonstrating all the Most Wanted features of Version 2010, our latest software release that includes XBRL enhancements in XMLSpy, support for WSDL 2.0 in XMLSpy and MapForce, a new absolute positioning design paradigm in StyleVision, database schema conversion in DatabaseSpy, and much more. With the new emphasis on software modeling in Microsoft development tools, you’ll want to check out SysML and all the other new functionality in UModel 2010. We love L.A., but if you’re not going to PDC this year, be sure to check the Altova blog again later for updates about the event and more details about Version 2010.

Tags: , , , , , , , , , , ,

XBRL Glossary


The biggest hurdle for a lot of people (myself included) when they first start looking at XBRL is the vocabulary used in the specification. There is, of course, some overlap with terminology from the XML and business reporting worlds – handy for the handful of you with a background in both – but some of the terms are entirely new and sometimes even a little cryptic (if you don’t believe me, try looking up hypercube on Wolfram for a bit of fun). Altova has published a comprehensive XBRL glossary (many thanks to Neal Hannon and Eric Cohen for their comments/suggestions) that we hope will clear some of the fog. So hopefully the next time you run headlong into a hypercube, you will feel safe knowing that hypercube has, at least in the context of XBRL, nothing to do with it.

Tags: ,

New XBRL Video


We recently posted a new, five-minute XBRL Overview video on YouTube! Please check it out and let us know what you think!  

Tags: ,