On the heels of our RaptorXML announcement earlier this month, we are very excited to tell you about the availability of three more new products that round out the Altova server software product family.
These high-performance server products are optimized for multi-CPU servers and are highly complementary when used together for defining and managing information pipelines. Cross-platform support is immediately available for Windows and Linux, with MacOS support expected just around the corner in May. Supported languages include English, German, Spanish, and Japanese.
Let’s take a look at each of these new products in detail.
FlowForce Server
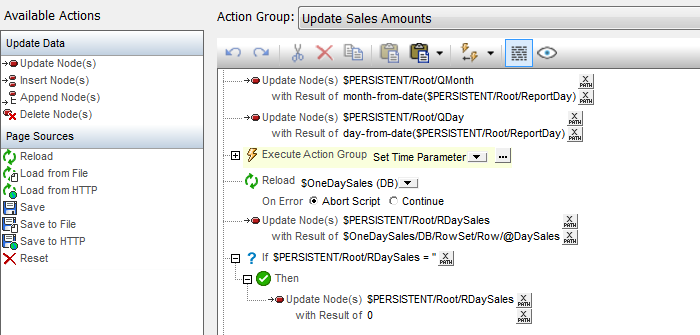
After receiving valuable customer feedback during the beta period, we have announced general availability of FlowForce Server, a powerful new tool for managing multi-step, enterprise-level data aggregation, processing, and reporting tasks. The straight-forward FlowForce Web browser interface makes it easy to configure and monitor jobs, whether they require a single step, or multiple cascading steps starting with data aggregation and conversion, and completing with multi-channel report generation.

A flexible and highly customizable system of job triggers lets you schedule FlowForce Server job execution based on each job’s unique requirements. Jobs can be triggered by date and time, by the arrival of files in hot folders, or by http command – and you can define multiple triggers per job. To take full advantage of server resources and meet the demands of busy data transformation workflows, multiple jobs – even multiple instances of the same job – can run simultaneously on FlowForce Server.

FlowForce Server provides strong security measures through user, role, job credential, and permission definitions that enable multiple simultaneous jobs while preventing unauthorized access to restricted data repositories or system resources.
So, what kind of jobs can you set up on FlowForce Server? Most customers will want to use it in conjunction with MapForce Server and/or StyleVision Server for high-performance automation of data integration and multichannel publishing projects that doesn’t require writing or compiling any source code.

MapForce Server
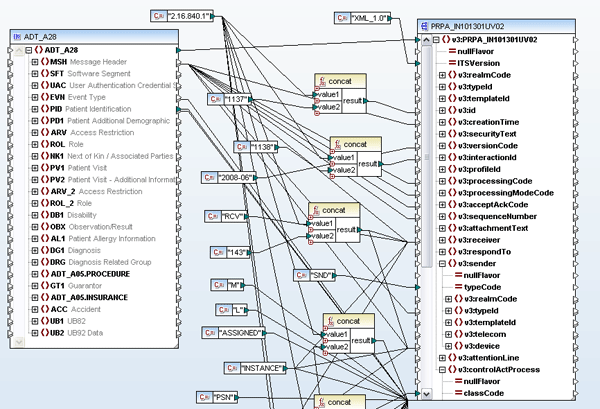
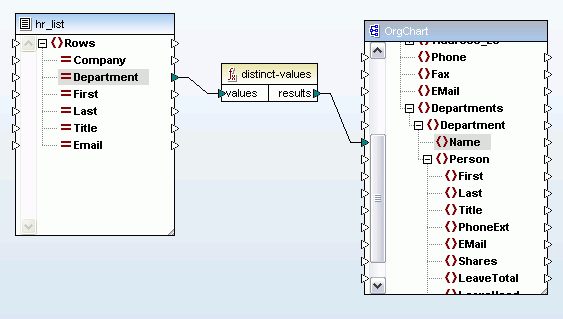
You may already be familiar with MapForce, Altova’s desktop developer software for aggregating, mapping, and converting data. We describe it as an any-to-any data mapping tool because it lets you move between any combination of XML, SQL database, flat file, EDI, Excel, XBRL, and Web services data. With the introduction of MapForce Server, it’s now easy to fully automate those transformations that have been defined in MapForce.
MapForce Server performs data transformations based on preprocessed and optimized data mappings stored in MapForce Server Execution files prepared by MapForce and uploaded over a network. Preprocessing enables faster performance and reduced memory footprint for most data mappings.
When operating under the management of FlowForce Server, MapForce Server is a powerful transformation engine suitable for the high-volume, quick turn-around demands of today’s leading edge data centers. The standalone version is suitable in a department level or other small environment that does not require the extensive multi-tasking, job scheduling, and security features of FlowForce Server.
StyleVision Server
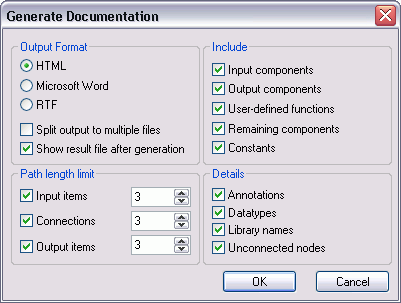
StyleVision Server provides high-performance automation of report and document generation tasks based on templates designed in Altova StyleVision. A graphical XSLT stylesheet and report design tool, StyleVision helps you create one design to render XML and XBRL data in Web and print formats including HTML, Word, RTF, and PDF, simultaneously. Using StyleVision Server, you can generate reports from XML and XBRL data on a recurring basis faster than ever before.
Like MapForce Server, StyleVision Server is an important option for document production by FlowForce Server, and the standalone version can be run from the command line and is suitable in smaller deployments that may not require all the features of FlowForce Server.
This new line of Altova server products represents a huge leap forward in effective automation of essential business processes, whether they require a single step, or multiple cascading steps starting with data aggregation and conversion via MapForce Server and completing with multi-channel report generation via StyleVision Server. These high performance workflow servers help customers design information pipelines quickly and easily, and then deploy them in a flexible way, utilizing the power and speed afforded by multi CPU servers. We’re excited to offer this new family of server products to our customers developing data integration and reporting projects using Altova MissionKit developer tools, as well as welcoming new customers who need a multi-platform, lightning fast orchestration engine.

As with all Altova tools, we invite you to try these new server products before making a purchasing decision. Download a free, 30-day trial now!


 Secondly, we were headed mostly west, following the river downstream, but the track shows a predominantly uphill trend.


 Or, to go in the other direction, it’s just as easy to


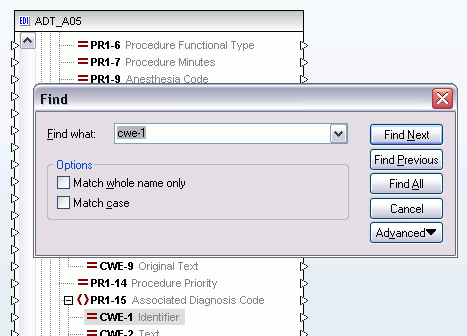
 MapForce also now includes a predicated position function that lets you filter out data based on its context position in the input document. For example, the mapping below will return data for only the first two people listed in the source document.
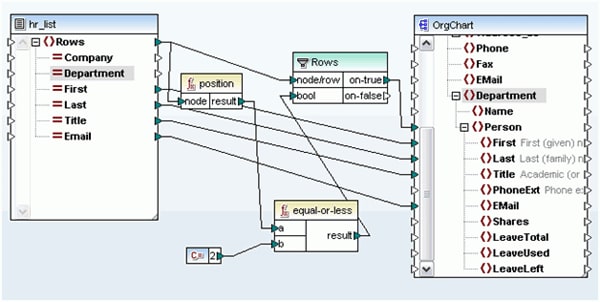
 Ahhh… much easier!! Take a look at the full list of