Build Advanced XML Reports with New XPath Debugger
Altova StyleVision is a unique, easy-to-use tool for creating business reports using a drag-and-drop visual design interface. StyleVision lets you build reports for XML as well as database and XBRL sources. Each design you create can be automated for recurring reporting to HTML, PDF and Word, either using the auto-generated XSLT stylesheet or via StyleVision Server.
Integral to XSLT stylesheet design is XPath for selecting and calculating data, as well as defining styling rules, in your report. New features added to StyleVision include an XPath debugger that makes testing and perfecting your report easier than ever. Let’s see how it works.

Troubleshoot XPath in XSLT
There are many ways to use XPath to select and filter data when building an XML report in StyleVision, including defining tables and charts, defining conditional formatting, specifying sophisticated styling rules, and performing numerical calculations.
A built in XPath editor helps you compose XPath expressions with syntax coloring, context sensitive entry helpers and code completion, and detailed error messages. Evaluator mode in the editor gives you real time results as you type.
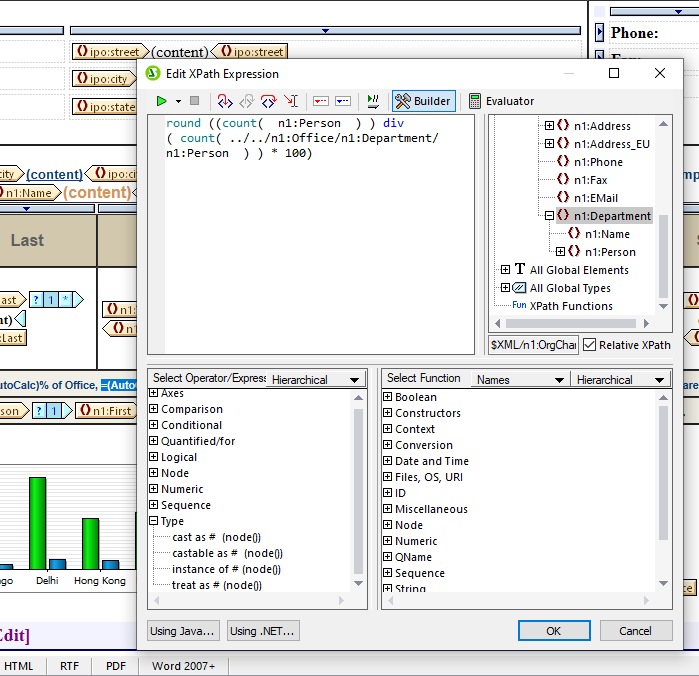
For further help and troubleshooting, the XPath expression editor dialog also includes a full XPath debugger that lets you walk through and debug an XPath expression in the context of a working XML file. This way you can see exactly how your expressions will function when you publish XML to PDF, HTML, and/or Word formats.
Once you enable debug mode via the toolbar, you can switch between Builder mode for editing the expression and Evaluator mode for debugging it.
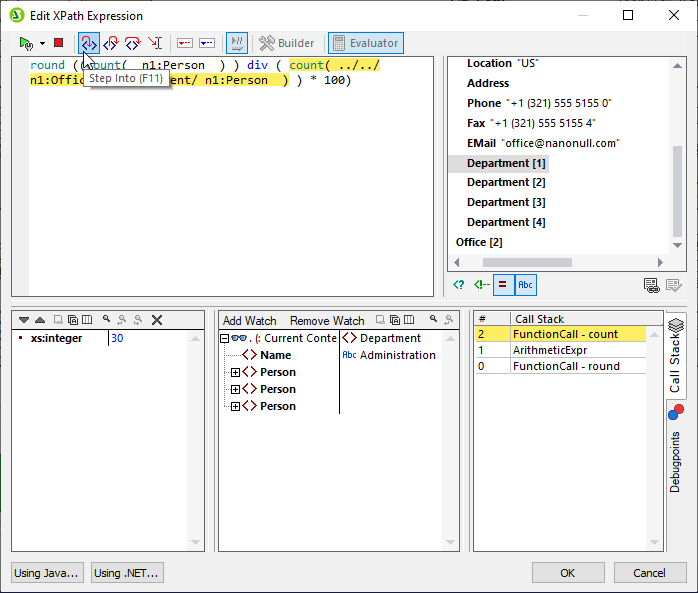
The XPath debugger window lets you move step-by-step through the evaluation of the current XPath expression and examine the results at each point in the evaluation. Buttons in the toolbar allow you to step into, step out, and step over evaluation steps to zero-in on the sections you need to troubleshoot.
In addition to the main Result pane, the Debugger pane contains a Watch pane and Call Stack pane. Variables and watch expressions are configured in the Watch pane, and the Call Stack pane displays the various processor calls up to the current point in the debugging process. The most recent calls are on top, and the current call is highlighted in both panes. By clicking to select the calls in the Call Stack pane, you can you can see the context and variables at each step in the stack.
In addition to stepping into the evaluation, the XPath debugger gives you the option to set breakpoints to pause the evaluation and check results only at these points. In this case, you would use the step through option.
Setting trace points allow you to see a report of results for each point without pausing the evaluation. Results of breakpoints and trace points are shown in the Debugpoints tab of the Call Stack window.
All these options give you the tools you need to debug an XPath expression using the approach that best helps you isolate the segments causing a problem.
Learn More
Make sure you’re running the latest version of StyleVision to access these powerful XPath tools for designing and refining your business reports. Update your software or download a free, 30-day trial to get started.
If you need to brush up on XPath, be sure to check out this Intro to XPath tutorial or our full XPath training course.