Analyze JSON Data with Filters, Formulas, and Charts
Software developers and other data professionals often need to examine new data instances before designing processes for efficient production. As JSON becomes a more popular format for data exchange, the tradeoff for smaller data payloads can be loss of clarity of the underlying data structure.
XMLSpy has supports viewing, modeling, and editing JSON files and includes rich tools to analyze JSON data, including applying filters, formulas, and charts.
Let’s take a look.

The XMLSpy Online Help and the Examples project that installs with XMLSpy are a great place to start.
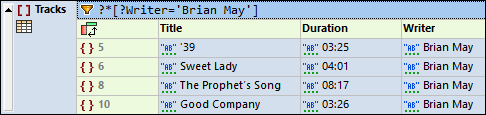
The Online Help includes instructions and illustrations for applying filters and formulas. In the image below a filter has been applied to a JSON document containing data about record albums to list only the songs written by Brian May:
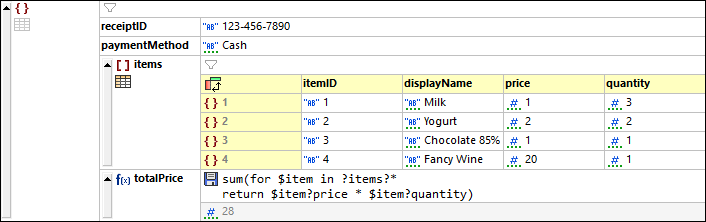
In this illustration a JSON file contains a description of a grocery order and a formula is applied to calculate the total price:
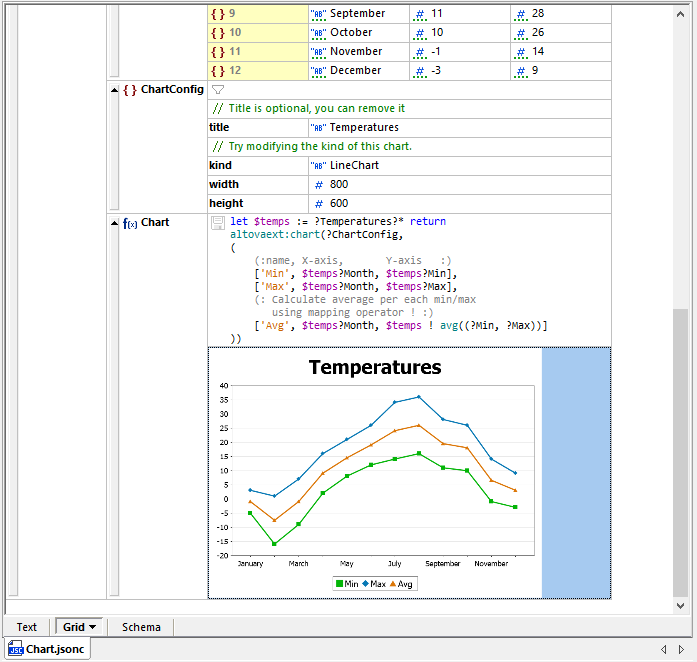
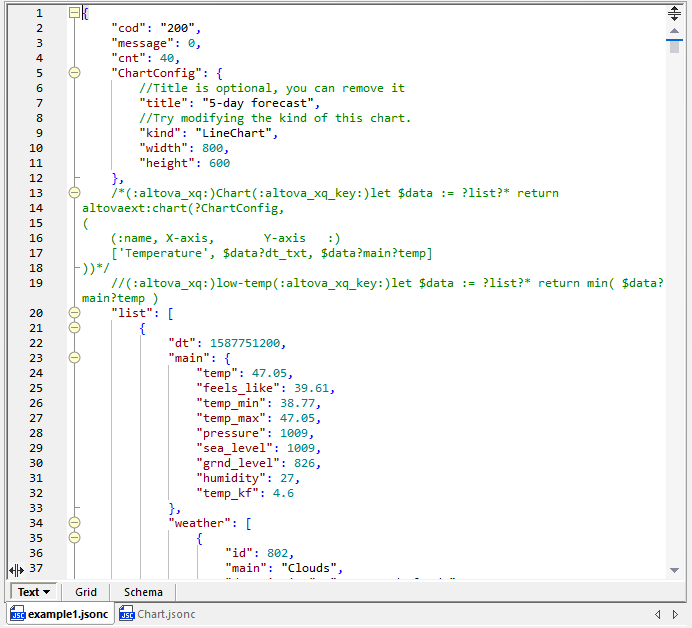
The example file Chart.jsonc describes minimum and maximum temperatures by month. This data is used to create a chart that also shows a calculated average for each month:
All the images above were generated from .jsonc files. Since JSON documents other than JSON5 do not allow comments, the JSON with Comments format (JSONC) has been introduced to allow comments in JSON documents.
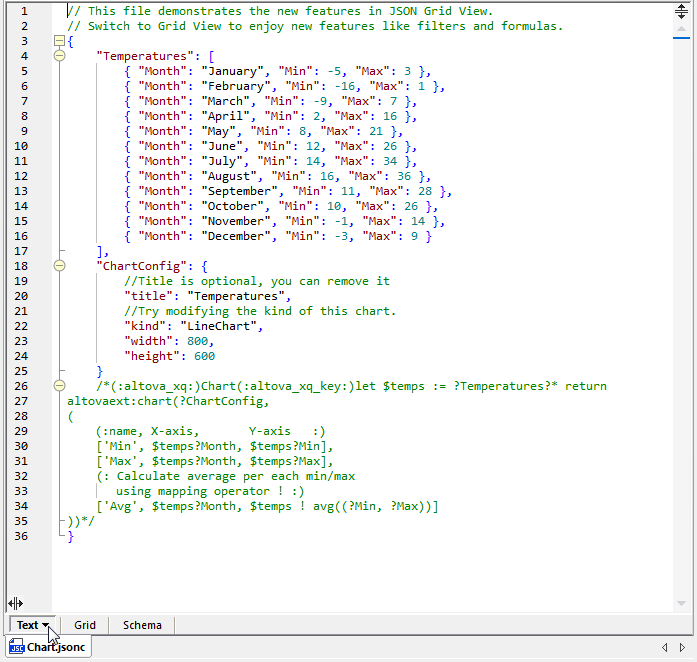
The filters, formulas, and chart features for JSON Grid view are implemented as XQuery functions stored in comments that are interpreted by XMLSpy to analyze JSON data, as can be seen by viewing the Chart.jsonc file in text view:
These examples can suggest strategies for efficient completion of real-world development challenges, especially for projects where you need to consume larger JSON data files from external sources.
Analyze JSON Data Retrieved from Web Services
Let’s say we’ve been tasked to process 5-day weather forecast data for some random number of cities anywhere in the world. Data like this might be useful to predict shipping schedules between major destinations or even for recreational sailors vacationing in the tropics. Many APIs are available to retrieve information about weather and they all provide data in somewhat different formats. For this post we will look at data from the openweathermap.org API.
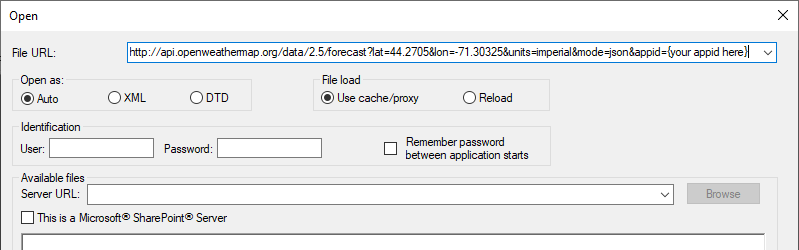
We can issue a REST request to the API directly from the File/Open main menu selection in XMLSpy. Simply click the button labeled Switch to URL at the bottom of the Open dialog and enter the API call as the File URL:
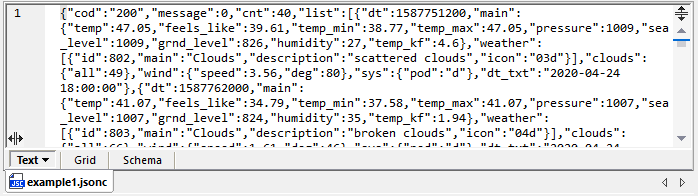
The result of the API call will be opened in the main editing window. There is no prolog for JSON data to identify the format or version, so it won’t automatically be recognized, but you can use File/Save As and apply a .jsonc file extension:
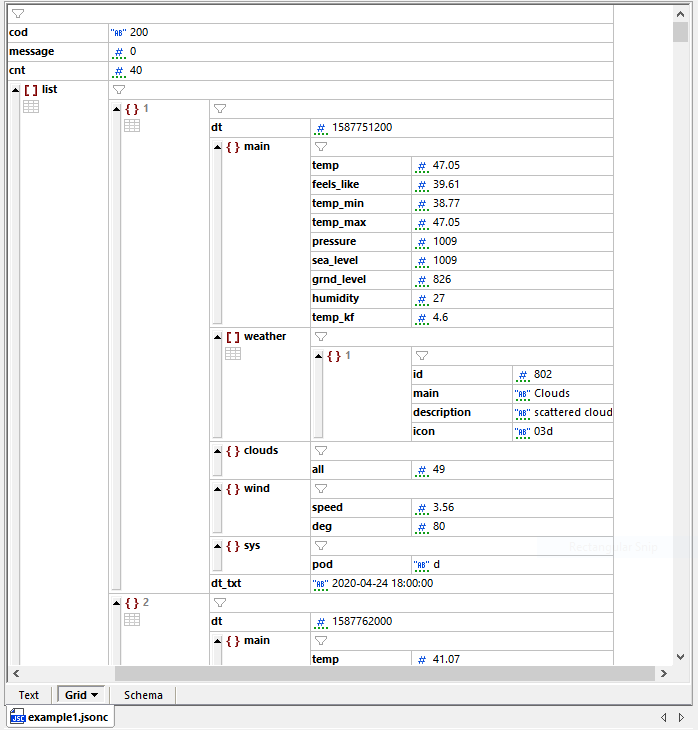
Clicking the Grid button changes to Grid View and the JSON data is immediately more comprehensible:
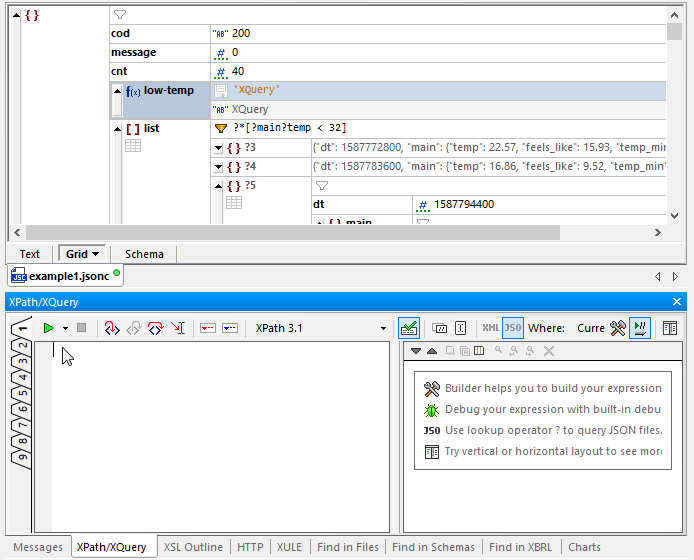
The first thing we might want to do is check to see if the temperature is predicted to go below freezing for this location. This is easily accomplished by applying a filter to the list array. We can click the filter icon to the right of [ ] list at the top of the array and type an XQuery expression, following the filter example in the XMLSpy Help as a guide to syntax. The filter is immediately applied to display only the predictions for temperatures below freezing:
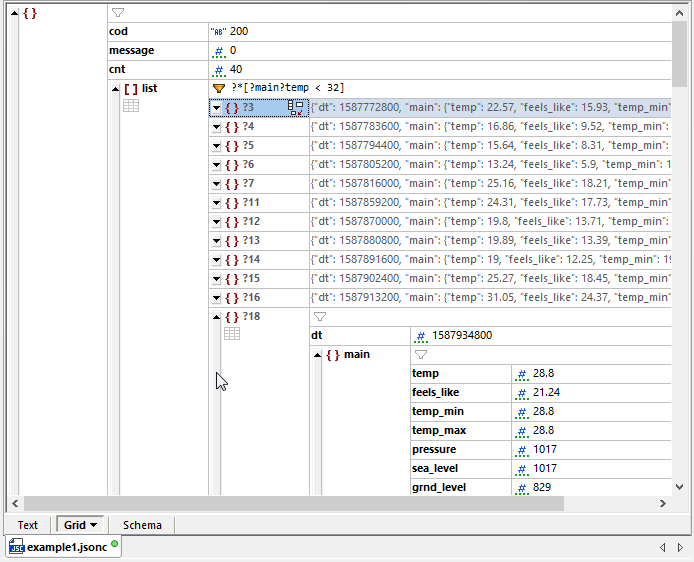
Since we are only interested in the temperature values right now, we also collapsed the view of each item in the array by clicking the gray scroll bars to the left of each item number, as shown above. It’s clear now this particular location will have some chilly nights!
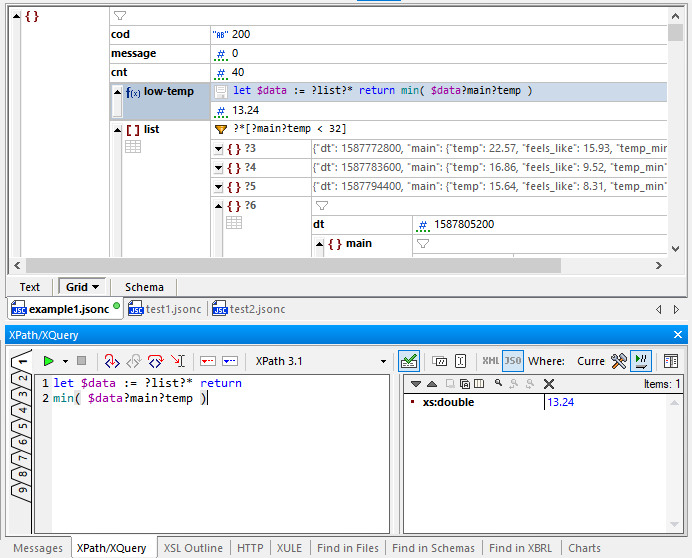
Now we might want to find the lowest temperature predicted in this forecast. We can apply a formula to do that. In the image below we inserted a new node at the list array, changed its type to formula and gave the formula a name. Rather that type the formula directly into the Grid view, we can use the XQuery helper window to build, test, and debug an XQuery expression:
We can paste the completed expression from the XQuery editor into the JSON Grid view:
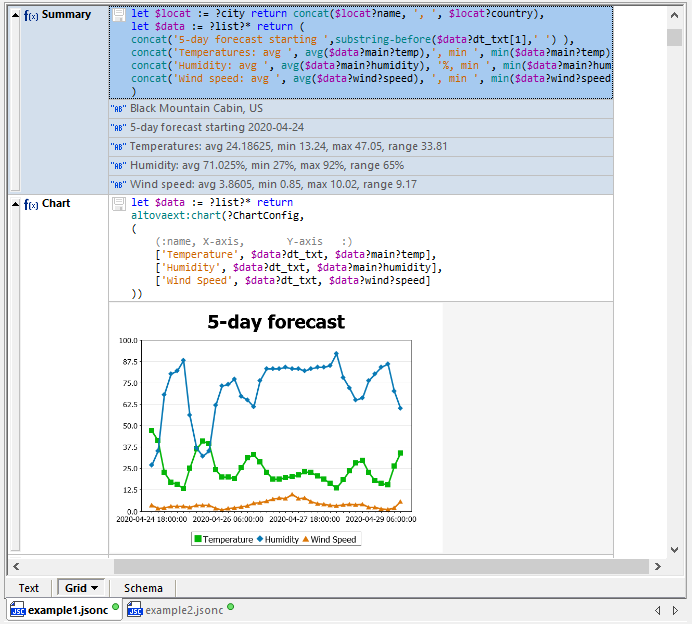
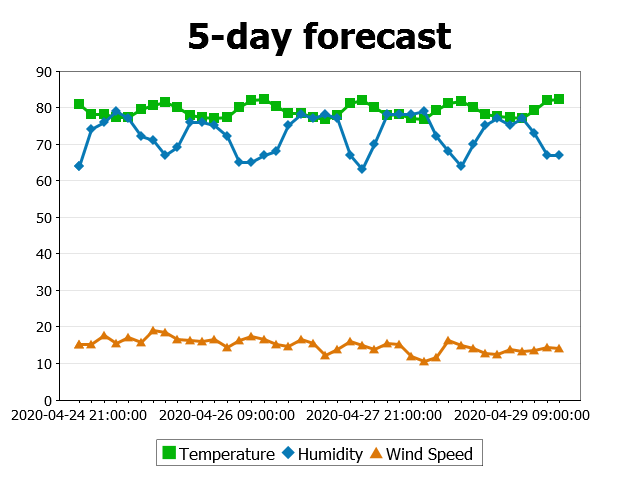
Using a similar strategy and working from the Chart.jsonc example, we can add a chart to visualize the data:
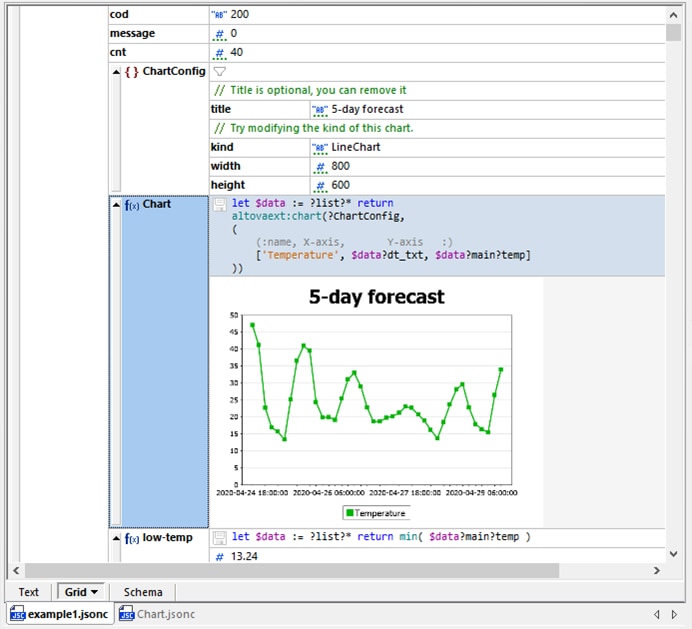
The ChartConfig elements define parameters used by the chart function, but even the chart function itself can be built in the XQuery window:
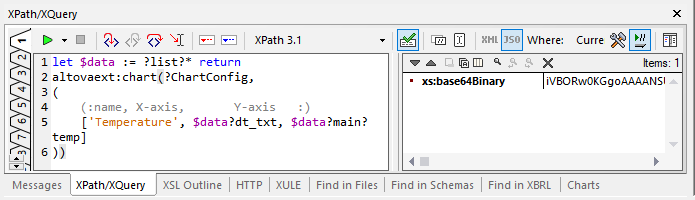
Successful evaluation displays the binary image data in the result window. You can also right-click the chart to export it as an image file. The dimensions of the image are set by the width and height parameters of ChartConfig.
Functions added to the .jsonc data are stored in comments, as seen here when we switch back to text view.
If we want to apply the same functions to other JSON data retrieved from the API we have two options. We can either use the XQuery helper window to temporarily hold an expression and apply it to another .jsonc document, or we can copy and paste the entire set of expressions.
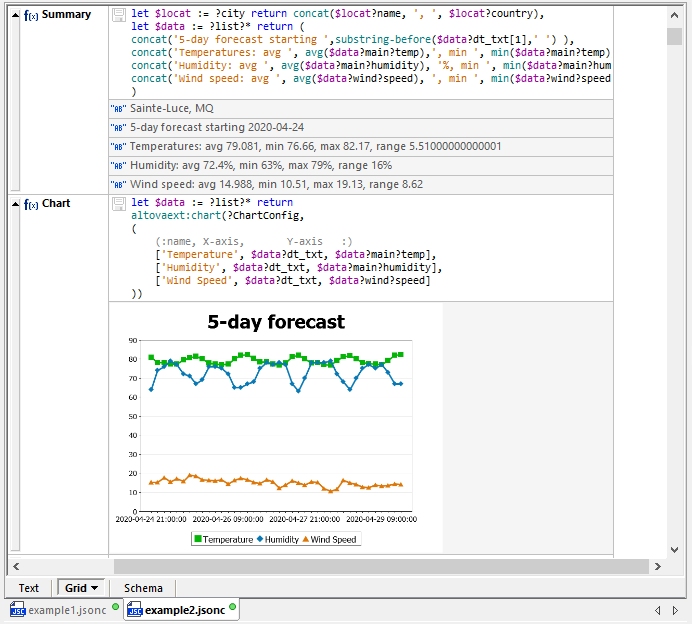
First, let’s add more calculations to enhance the analysis:
Copying the comments from the source document and pasting them into a new data set from the API generates an instant analysis:
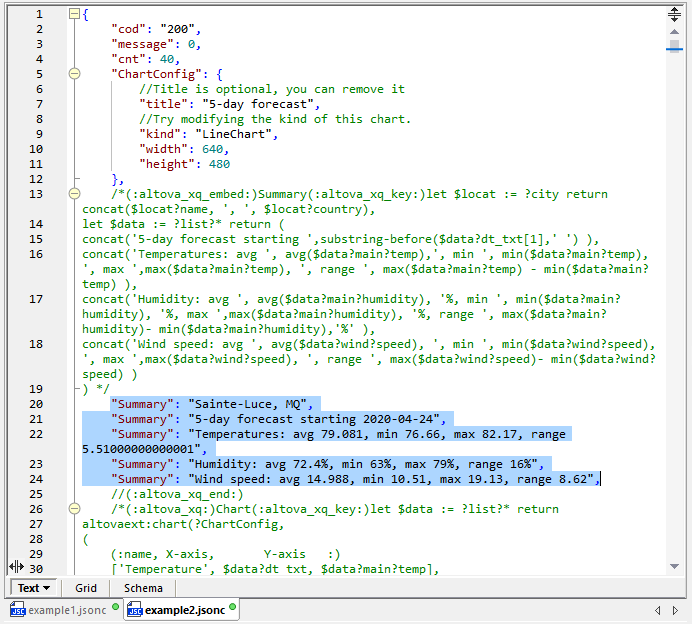
You can easily share your discoveries with other team members. If you click the disk icon by the function definition, the results are embedded as JSON data in the file:
Or you can save the chart as an image file to use in a report:
Every data integration and reporting task needs to start with a clear understanding of the source data. Using XMLSpy to analyze JSON data can speed you to success with your own project. For another perspective, this video demo presents filters, functions, charts, and many more powerful features of JSON Grid view.
Download a free trial including the Online Help, Tutorial, and many real-world examples today!