Altova MissionKit 2011 is Now Available!
 The Altova team is excited to announce the release of Version 2011 of our MissionKit tool suite and entire product line. This release delivers a multitude of innovative features, including robust chart and reporting functionality for analyzing and communicating XML, database, XBRL, EDI – virtually any type of data – in a meaningful, eye-catching way. Charts are created with a few clicks inside MissionKit tools and can be immediately shared via copy/paste or saved as image files – that’s right, no more exporting to Excel – or integrated in reports or data entry applications designed in Altova StyleVision. Of course, you can also get the XSLT or XQuery code for generating the chart for use in your own apps. The MissionKit 2011 includes a wide range of other new features– like SOAP validation, schema flattening and subset creation, database UML diagrams, and more – and we’ll cover all of those subsequent blog posts. For now let’s focus on the new charting and reporting features across the Version 2011 MissionKit.
CHARTS
Charts can now be generated and used in the MissionKit 2011 XML and database tools in a variety of ways. The following types of charts and graphs are available for providing a graphical representation of numerical data:
- 2D & 3D pie charts
- 2D & 3D bar charts
- Category line graphs
- Value line graphs
- Gauge charts
Charts are fully dynamic and can be automatically or manually regenerated when backend data is updated. XMLSpy You can create a new chart directly in the XML editor by simply highlighting a range of data in either Text View or Grid View and selecting New Chart from the right-click context menu. 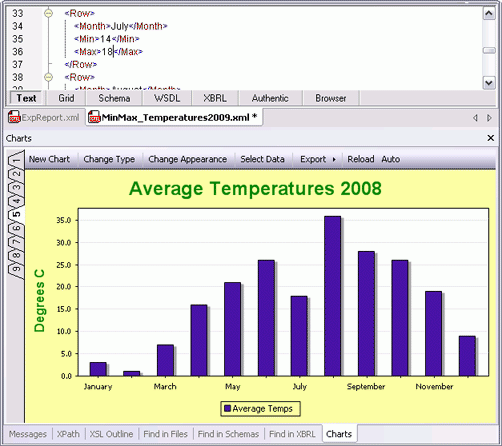 The chart’s appearance, labels, and so on, are highly customizable, and your finished chart can be printed, copied to the clipboard, saved as an image, or – and this is truly unique – exported as XSLT or XQuery code for use in your own stylesheets, reports, or apps.
 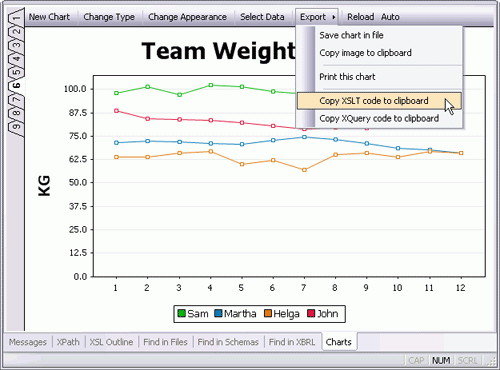 XMLSpy is the first and only XML editor on the market to support this powerful functionality, giving our users a distinct advantage when it comes to analyzing and interpreting XML data. You can also create a chart to visualize the results delivered by the XMLSpy XSLT Profiler and XQuery Profiler, making it easy to interpret and communicate performance data. StyleVision Charting and graphing support in StyleVision 2011, the stylesheet and report design tool, allows you to present data in a powerful, visual way, so that it can be easily analyzed from a variety of different angles. When you’re creating an XML, database, or XBRL report (or even a data entry form for use in Altova Authentic), it’s easy to specify your chart parameters via XPath and then customize the appearance of your chart or graph.
 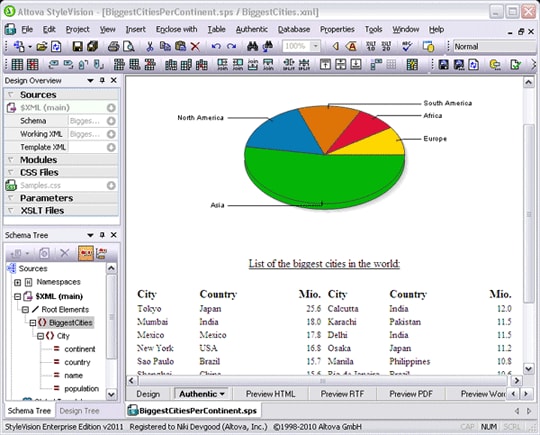 You can even utilize dynamic XPath settings to apply dynamic data from your source to the settings of your chart. For example, if you have a chart that shows regional data, you may wish to reflect the name of each region in the title of your chart. If there are several Region elements, the data for the chart title can be selected dynamically via an XPath expression depending on which set of data is being presented in the chart. Charts are integrated in multi-channel StyleVision reports, described further below. DatabaseSpy Relational database data often lends itself perfectly to a graphical representation, but it’s not always easy to create charts to analyze relationships locked away in database tables. Now, with DatabaseSpy 2011, it’s as simple as selecting the column(s) you wish to chart.
 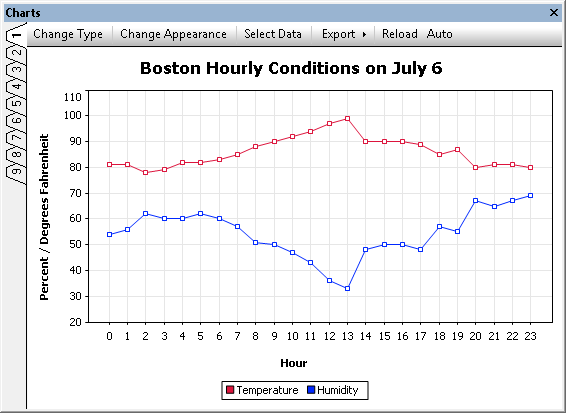 You can even generate and save charts based on calculations performed in a SQL query – such as averages, percentages, etc. As with XMLSpy, charts may be saved as image files, printed, and copied to your clipboard. DatabaseSpy supports all major relational databases, and even with this charting functionality and its other advanced tools, it’s ridiculously affordable.
REPORTS
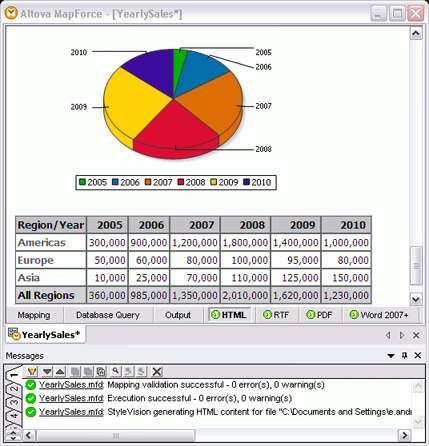
StyleVision The new chart creation functionality described above adds a whole new level of sophistication to Altova’s general purpose reporting tool, StyleVision. While you’ve been able to design attractive XML, database, and XBRL reports in previous versions of StyleVision, now you can also include dynamic charts for full featured, multi-channel reporting in digital formats like HTML and e-Forms, and print media including Word and PDF. Advanced options such as drag-and-drop design, absolute positioning, modular designs, conditional templates, support for importing and/or reusing existing XSLT stylesheets, dynamic data selection, and more, combine to make StyleVision robust solution for business reporting on any scale. 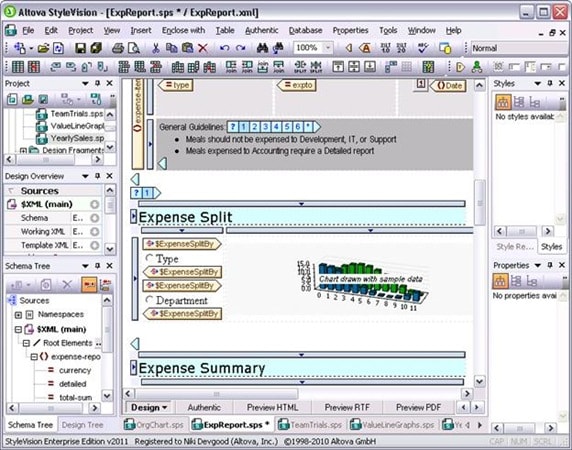 In fact, StyleVision now integrates with MapForce – so you can design reports for virtually any type of data. MapForce Starting with Version 2011, MapForce supports integration with StyleVision, allowing MapForce users to automatically render results of their XML and XBRL mappings using an associated StyleVision report design. This very powerful feature essentially combines MapForce’s any-to-any data mapping capabilities with a sophisticated rendering engine, meaning that you can now automate chart and report generation from virtually any data format – including databases, flat files, Excel, EDI, and more – that can be mapped to an XML Schema or XBRL taxonomy.
DOWNLOAD VERSION 2011
Whether you need to generate charts while working with XML or databases, or you need to design full-featured reports with dynamic, multi-channel output, we hope you’ll check out the new MissionKit 2011. Then, post a comment here on the blog to let us know what you think! Upgrade or Download a Free Trial See more details and screenshots, or download Version 2011 now. Current customers with active support and maintenance can download the new version for free. A fully functional 30-day trial is also available.
STAY TUNED…
More details about all the new features added in Version 2011 will be posted in the coming days.
