StyleVision Supports XBRL for Financial Reporting Part I – Creating GAAP-Compliant Reports and StyleSheets with a Single Click
Did you know that StyleVision is also an XBRL rendering and reporting tool that will allow you to create GAAP-compliant financial reports with the click of a button ? 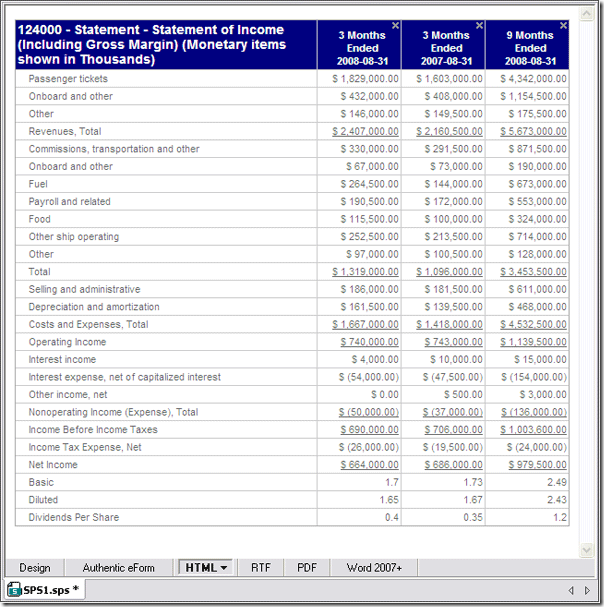
In this post we’ll show you how …
Altova’s native support for XBRL is great news for IT professionals serving a range of industries given the US Securities and Exchange Commission’s (SEC) formal embrace of XBRL as a financial reporting language. In fact, virtually all public companies using GAAP accounting will be required to submit financial data for fiscal periods ending on or after June 15, 2011 to the SEC in XBRL, an XML-based language. IT professionals will be called upon not only to facilitate the exchange of data but to render XBRL data in a manner intelligible to business users. StyleVision can help. With a number of built-in capabilities that allow you to create customized GAAP-compliant stylesheets and reports for XBRL data with only a few clicks, StyleVision can make you look like a technical – and accounting – whiz. When you create a new design from an XBRL taxonomy, StyleVision creates a schema tree that reflects the presentation linkbase, an XML file that includes sets of related concepts grouped under presentation links (e.g., in the example below, 006091- Disclosure – Segment Revenue and Operating Income is a presentation link). Typically the presentation linkbase will appear in the schema tree as discrete financial statements, addendums, disclosures, and the like (this will depend on the contents of the linkbase – and keep in mind that although standard not every XBRL taxonomy will have a linkbase). Individual root elements are also available for reporting/processing and appear below the presentation links. 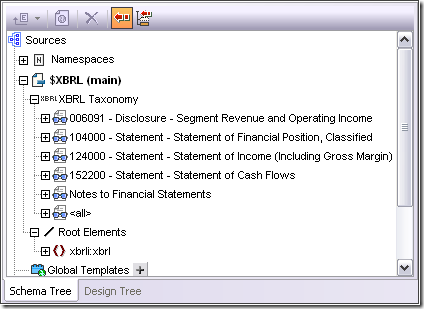 To create a stylesheet or report, drag the appropriate presentation link into the design window (for this example we have selected 124000 – Statement – Statement of Income (Including Gross Margin)). You will be prompted to create an XBRL table, XBRL chart, or XBRL template.
 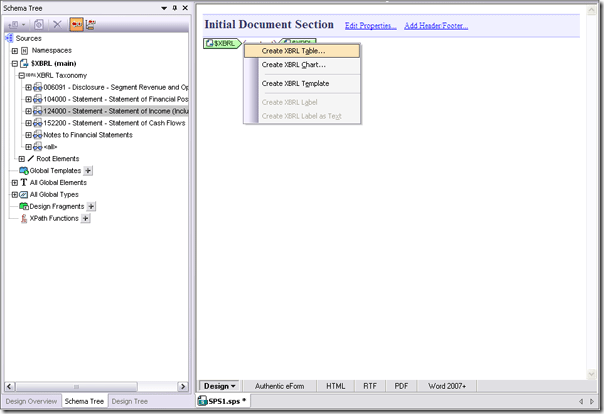 Selecting Create an XBRL Table will invoke the XBRL Table Wizard.
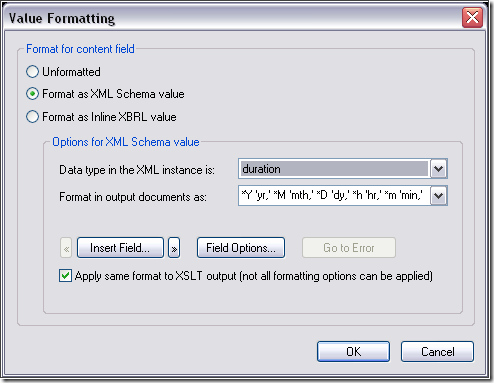
 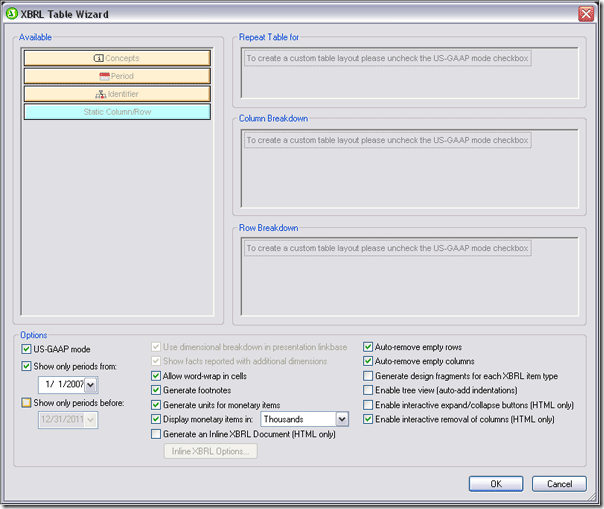 Note that under Options we have US-GAAP mode checked. If you check the US-GAAP mode box StyleVision will generate a table with all of the financial data in the presentation link selected. (You can select which period you would like represented under the Options tab as well). Output in HTML, RTF, PDF, and Word 2007+ formats, plus corresponding stylesheets, are automatically generated once you click OK. Although there are a number of formatting options in the Table Wizard, once the table is generated you can make additional changes (e.g., background color, font, text, table borders, etc.). In the example below we highlighted the <xbrli:instant> element and used Value Formatting to change how the time periods are represented. In the XBRL instance document, the time period appears in YYYYY-MM-DD – YYYY-MM-DD format. We have changed it to [Number of] Months Ending YYYY-MM-DD.
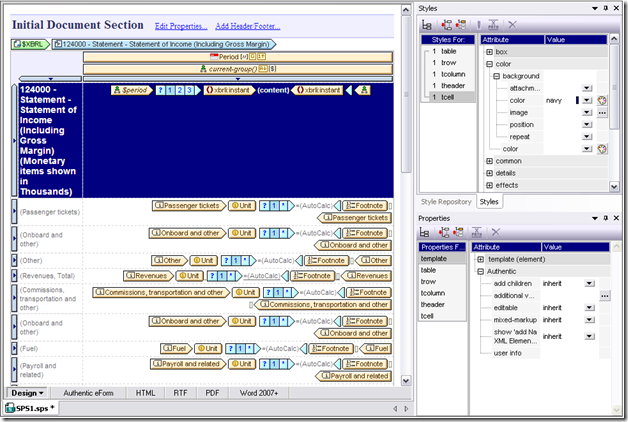
  Notice the Styles window in the screenshot below – we’ve also changed the table header’s background color to navy and the text color to white.
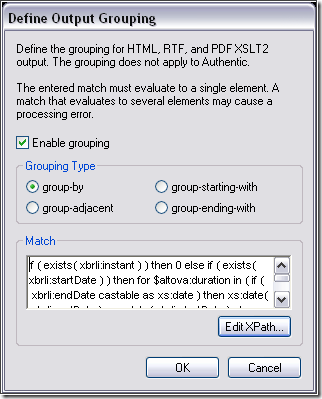
  Sorting, grouping (via XPath), and filtering (via XPath) options can also be edited after the table is generated by the XBRL Table Wizard. Simply right click in the Period or current-group bar above the table header and select the appropriate function. The Group by … dialog box appears below.
  The GAAP-compliant table rendered in HTML appears below.
  The HTML output above reflects the formatting options we selected in the XBRL Chart Wizard:
- As indicated in the header, monetary items are shown in thousands because we selected Thousands in Display monetary items in under Options
- We checked Auto-remove empty rows and Auto-remove empty columns so there are no empty rows or columns
- Because we selected Enable interactive removal of columns (HTML only) under Options in the XBRL Chart Wizard the end user can click the “x” in the corner of a column to hide it
- We did not select Enable tree view so the labels are all left justified and do not reflect the hierarchy of the schema
- We did not enable Interactive expand/collapse buttons so they do not appear
One last thing to note is that in our example we have selected the entire presentation link 124000 – Statement – Statement of Income (Including Gross Margin) and all data in that presentation link is populated to the table. However if you expand the presentation link in the schema tree you can select individual line items or those grouped together from a presentation link and create a mini-table. This is just an overview of how you can use StyleVision’s built-in GAAP-compliant functionality to render XBRL data in some simple ways – the possibilities for presenting this data are virtually limitless. In future posts we’ll discuss using the XBRL Table Wizard to combine multiple line items from different presentation links for highly customized data presentation, creating powerful charts with the XBRL Chart Wizard, and other ways to help organizations leverage their XBRL data (we’ll even provide an example of how XBRL financial data can be used with other data sources to create an annual report).
Have you used Altova tools to create XBRL solutions for your clients? Please share your story with other Altova users by commenting on this blog post. Think it would make a great case study? Email us at marketing@altova.com. We’d love to hear from you!

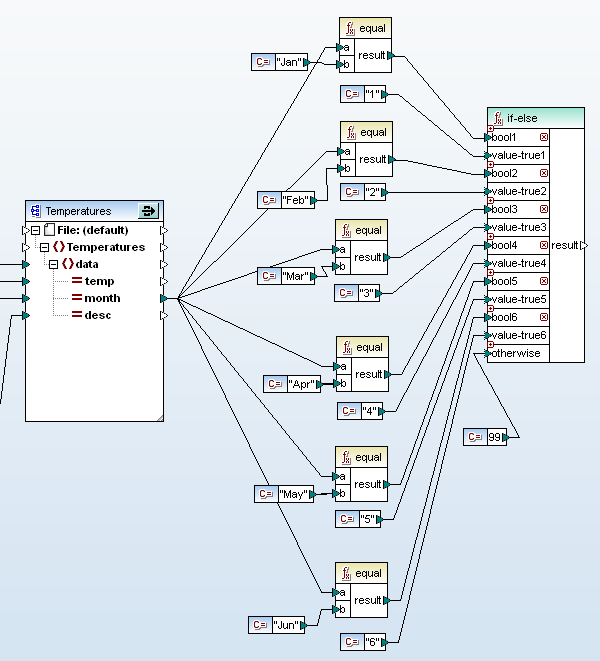

 When you compare different database types, DiffDog even resolves datatype naming inconsistencies. This means you can compare the customers table in your SQL Server database with a backup copy, for example, or you can compare the contents of any tables or your entire database schema between IBM DB2 9 and Oracle 11g implementations. Note: Altova
  Next, you can launch a detailed comparison of the unequal table to see the content of the compared columns side-by-side, with differences highlighted. Tool bar buttons let you merge changes in either direction.
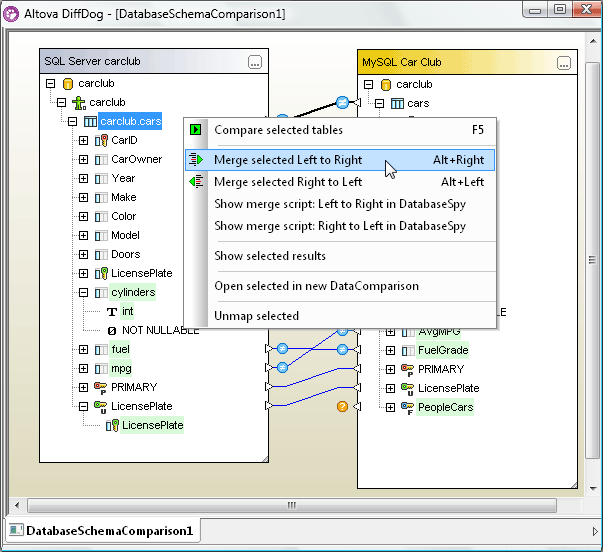
 You can also save the SQL script to a file or open it for further editing in DatabaseSpy. Learn more about the powerful