Harness the Power of Chained Transformations in MapForce


Altova MapForce includes the ability to define chained transformations. Chained transformations let you create complex mappings where the output of one mapping becomes the input to another. In other words, two or more components can be directly connected to a final target component. MapForce chained transformation example

Read more…

Tags: , , , , , , , ,

Hot off the Press!


The industry is abuzz with the latest news announcing our release of the MissionKit Version 2011 Release 2. The release is loaded with new features for chart and report creation, enhanced data mapping capabilities, new XML Schema editing functionality, support for the latest version of BPMN, and a really cool new feature for comparing and merging Microsoft® Word documents. clip_image002 Dr Dobb’s and SQL Server magazine are just a few of the industry publications and blogs that covered the launch. clip_image004   clip_image003 Read what the industry is buzzing about and then download a free 30-day trial of the MissionKit and check out for yourself all the powerful new features now available in our suite of XML, database, and UML tools!

Tags: , , , , , , , , , , , , , , , , ,

Advanced Presentation and Formatting in StyleVision


The StyleVision stylesheet and report design tool has added a plethora of advanced functionality over the past several releases. In this post we’ll explore some of the advanced presentation and formatting capabilities that make this tool so powerful. Data visualization (e.g., charts and graphs) and other graphical elements are de rigueur these days. Whether it’s showing change over time via a simple bar graph, highlighting performance with an image from the art department, presenting market data with a candlestick chart or developing a gauge for dashboard reporting, organizations today demand the ability to include sophisticated graphics on all sorts of output – including Web sites. Altova StyleVision 2011r2 can help you meet these demands with advanced presentation and formatting capabilities. You can use StyleVision to generate graphical representations of XML, database, and XBRL data for output to eForms, PDF, HTML, RTF, and Word 2007+. Advanced formatting capabilities will enable you to create impressive charts, graphs and other data views that resonate with audiences. In addition to 2D and 3D bar and pie charts, you can create line, area, candlestick, and gauge charts for use on Web sites or printed materials. Overlay reports provide you with the ability to juxtapose two data sets such as opening, high, low, and closing share prices (candlestick chart) with daily share volume (bar chart) as pictured here. Create Overlay Reports with StyleVision Comprehensive style attributes including colors, background images, legends, and even dynamic XPath settings provide you with complete control over how XML, database, and XBRL data are presented. Among pie chart attributes StyleVision users can select from, for example, are start angle, drop shadow, tilt (for 3D), color scheme (including user defined), and visibility of values, percentages, labels and legends. Create Advanced Pie Charts with StyleVision Adding background color and images is easy with drop down boxes – to achieve the yellow vertical gradient pictured in the overlay chart below simply go to All Settings under Appearance in the Chart Configuration dialog box, select Background Color in the Plot section of the General tab and select vertical gradient and the yellow color swatch from the drop down boxes.Advanced Charting with StyleVision StyleVision even offers users the ability to design templates so that output can be modified dynamically based on end user input. Below is an eForm that presents information in English and German depending on which button is toggled – conditional statements associated with a variable declared at the $XML template control this. Please note that the formatting in the Date field changes as well. Design Forms in Multiple Languages with StyleVision Design Forms in Multiple Languages with StyleVision Keep in mind that any form that you would like to reproduce in StyleVision can be imported as a “blueprint,” a configurable image that serves as a template. This allows the designer to place text, input fields, and other design elements directly on the template and makes it easy to build an eForm identical to the original. With advanced presentation and formatting for charts and graphs Altova significantly extends the capabilities of StyleVision’s already powerful report builder – your designs are limited only by your imagination. clip_image008 We’d love to hear how you are using these or other capabilities in developing your own projects. Please share your stories by posting to our Facebook wall or commenting here on our blog! If you haven’t tried StyleVision before, now is the time. Download a free, fully functional, 30-day trial from the Altova Web site now.

Tags: , , ,

Now Generate Barcodes in StyleVision


We’re listening.Altova clients have been asking us when they would be able to include barcodes in their StyleVision templates and now they can! StyleVision 2011r2 users can generate barcodes with a single click and insert them into an SPS template for use in eForms, as well as HTML, RTF, PDF, and Word 2007+ output. This brings even more advanced functionality to stylesheet and report design for XML, database, and XBRL data in this unique tool. Simply click on Insert Barcode from the Insert menu, define the type from the Barcode4J library and add the value used to generate the pattern (“text”). generate barcodes with StyleVisionCode 39 barcode generated by StyleVisionStyleVision gives users complete control over the presentation and appearance of barcodes – other properties that can be controlled via the dialog box include size, alignment, colors and borders. StyleVision barcode generatorYou can even use an XPath expression to assign a barcode to a property value.Altova is really excited about providing our clients with the ability to include barcodes in StyleVision-generated output. From larger companies supporting enterprise systems to smaller organizations looking to facilitate electronic data exchange without the use of middleware, StyleVision supports the goals of a broad range of users.Please note that a Java Runtime Environment 1.4 or later (32-bit or 64-bit as appropriate) must be installed to support this feature.

Tags: ,

Creating XML from Relational Databases


Sometimes following an example someone else created is a good way to get a quick start on a project. The downside is you might miss a better, more efficient solution. In our recent post on XML in the Cloud, we used DatabaseSpy to connect to a local MySQL database and to the Amazon Relational Database Service in the cloud. We used the Concat( ) function in a SQL SELECT statement to create XML formatted output from non-XML data as shown below. DatabaseSpy SQL query and result Our SELECT statement was based on an example in the MySQL documentation on XML support. Let’s take a little deeper look at the problem this statement tries to address. You can copy a DatabaseSpy Results table like the one displayed above and paste it into an editing window in XMLSpy, but the Results table alone does not create a well-formed XML document. To be well formed according to the W3C definition, an XML document must contain a root element. All other elements and logical structures must nest within the root. You can also think of the root element as a wrapper around the entire XML content, the same way the element <city></city> encloses each line in our original results. A Better Way to Create XML from Relational Data We don’t need to manually edit the results to add a root element, nor do we need to adapt our already-complicated SQL query to add the root. DatabaseSpy lets us easily export well-formed XML documents from database tables that contain ordinary data like our cities table. In the DatabaseSpy Export dialog we can choose XML Structure as the output format, click the cities table to select it from the database hierarchy, and choose XMLSpy as the destination. The Preview section at the bottom of the Export dialog shows a view into the table contents. DatabaseSpy Export Dialog When we click the Export button, DatabaseSpy formats the relational data with XML element names derived from the column names of the table and sends the resulting output directly to XMLSpy. The screenshot below shows a portion of the file in XMLSpy. The Message window at the bottom verifies the file is well formed. XMLSpy Editing window and Message window Note that DatabaseSpy supplied the root element <Import name = “cities”> and added comments to describe the datatypes of the database table columns. And, we did not have to construct a SQL statement with a cumbersome Concat( ) function. We began this post to address the simple requirement for a root element to complete the output of the Concat ( ) function we described earlier. When real-world projects require converting from relational databases to XML, the requirements are likely to be much more complex. Altova XMLSpy connects directly to all popular databases to work with XML technologies and relational data. XMLSpy lets you easily create an XML Schema from a database structure, or create a database schema from an XML Schema. XMLSpy also includes advanced editors and debuggers for XQuery and XPath for XML stored directly in databases, along with specialized support for XML features in Microsoft SQL Server, IBM DB2, and Oracle databases. As more industries adopt and evolve XML-based standards for information interchange, a common need is to convert data stored in legacy databases to XML. Altova MapForce connects to databases and allows you to map and transform relational data to be compatible with one or more XML Schemas. You can use your mapping to perform a one-time data conversion, you can save and re-open your mapping to perform another conversion later, or you can instruct MapForce to generate royalty-free source code from your mapping to include in your own project when repeated conversions are required. If you’d like to see for yourself how well Altova tools can generate well-formatted XML from relational databases, download a free trial of the Altova MissionKit.

Tags: , , , , ,

New XML Schema Editing Tools in XMLSpy


Let’s take a look at some of the new features for working with XML Schemas in the latest release of XMLSpy.

Sorting in Schema View

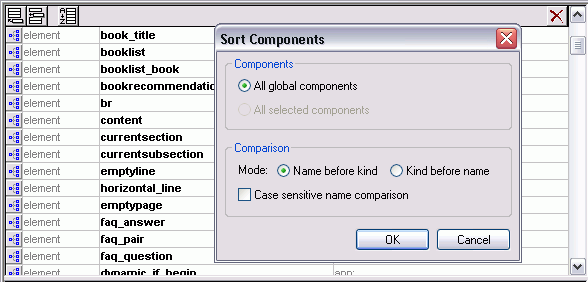
When you’re working in the graphical XML Schema editor, you can now sort some or all of the schema components alphabetically with a single click. This is a huge time saver when you need to organize large schemas that have evolved over time and for understanding new schemas that come across your desk. Simply click the A-Z button in the Schema Overview window and select the sort options you prefer. Your components are instantly sorted in the graphical view… xmlspy-sort-schema …and when you click over to Text View, the schema code itself is reordered and organized.

Schema Refactoring

Another new feature that’s invaluable when working with complex schemas or ones inherited from other developers is schema refactoring support. Taking advantage of XMLSpy’s powerful Find in Schemas functionality, you can quickly locate all the instances of a global element or type across a schema – and all imported and included schemas – and then rename that component in each place it occurs. This makes schema refactoring easy while ensuring the validity of all impacted schemas.

Intelligent Support for Changing Types

You may also find the need to change the type of an element or a base type, which previously meant reconfiguring all the facets associated with that component. This new feature gives you the option to preserve any facets or attributes that are compatible with the new type. Rename components to refactor schema  

Customizable XML Schema Documentation

Another option schema developers have requested quite often is the ability to customize the comprehensive XML Schema documentation generated by XMLSpy. This is now possible via integration with StyleVision. The StyleVision stylesheet design tool provides countless advanced options for customizing the documentation templates, from adding your company’s logo and branding to changing the appearance and organization of the documentation completely. StyleVision integration also gives you the option to generate documentation in PDF in addition to the HTML, Word, and RTF output options available for the fixed documentation in XMLSpy. Here’s an an example of XML Schema documentation we customized for the fictional Nanonull corporation: Embed image in XML XMLSpy 2011r2 also ships with several useful documentation templates that can be used as is or customized further in StyleVision:

  • XML Schema Structure Overview: documents the structure of global elements and complex types to the number of levels you specify
  • All XML Schema Type Derivations: displays all simple and complex types and their derived types in a tree format
  • XPath List: generates all possible XPath statements that are possible for a schema based on a user-specified number of levels
  • Statistics: lists the numbers of elements, types, attributes, groups, etc., for the overall schema, and for each associated schema file

To use a custom schema documentation template, you must have XMLSpy and StyleVision installed. If you are a MissionKit customer, you already have both tools and can take advantage of this feature and countless other options for working with XML Schema, from stylesheet and report design, to data mapping, and more. If you aren’t currently a StyleVision customer, grab a free trial from our Web site. The XBRL and WSDL documentation generated by XMLSpy may also be customized using StyleVision.   As always, we rely on your input and feature requests when planning each release – please let us know what you think of these new features and what you’d like to see in the next product version by leaving a comment here on the blog.

Tags: , , ,