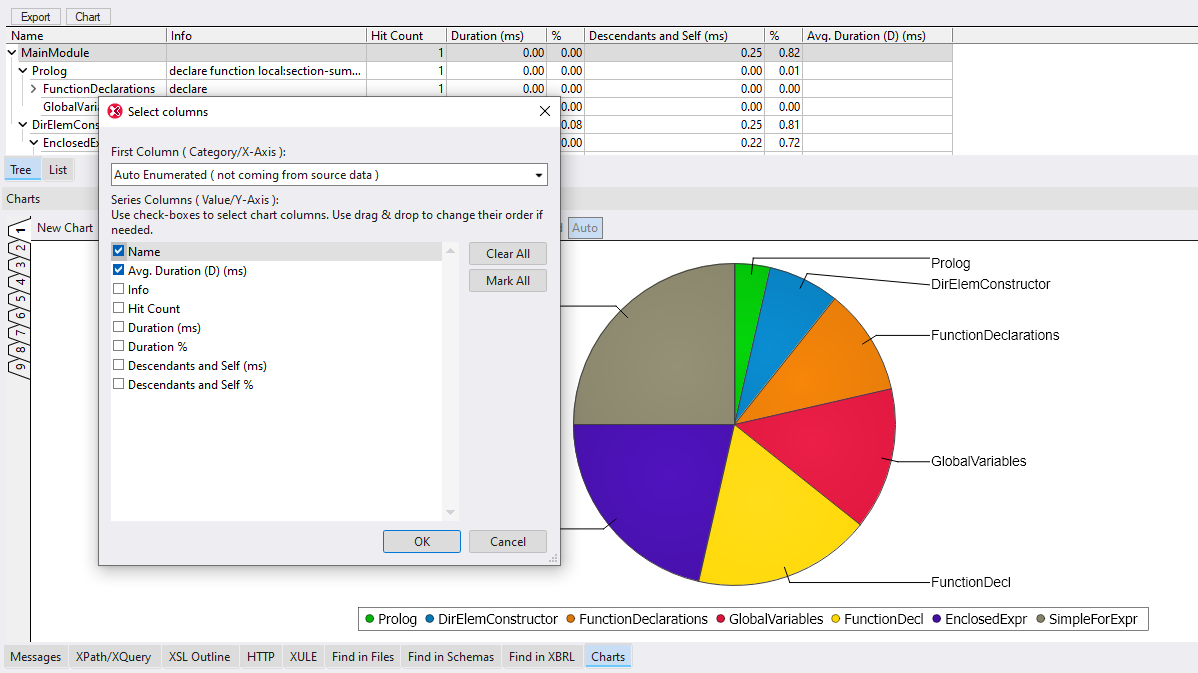
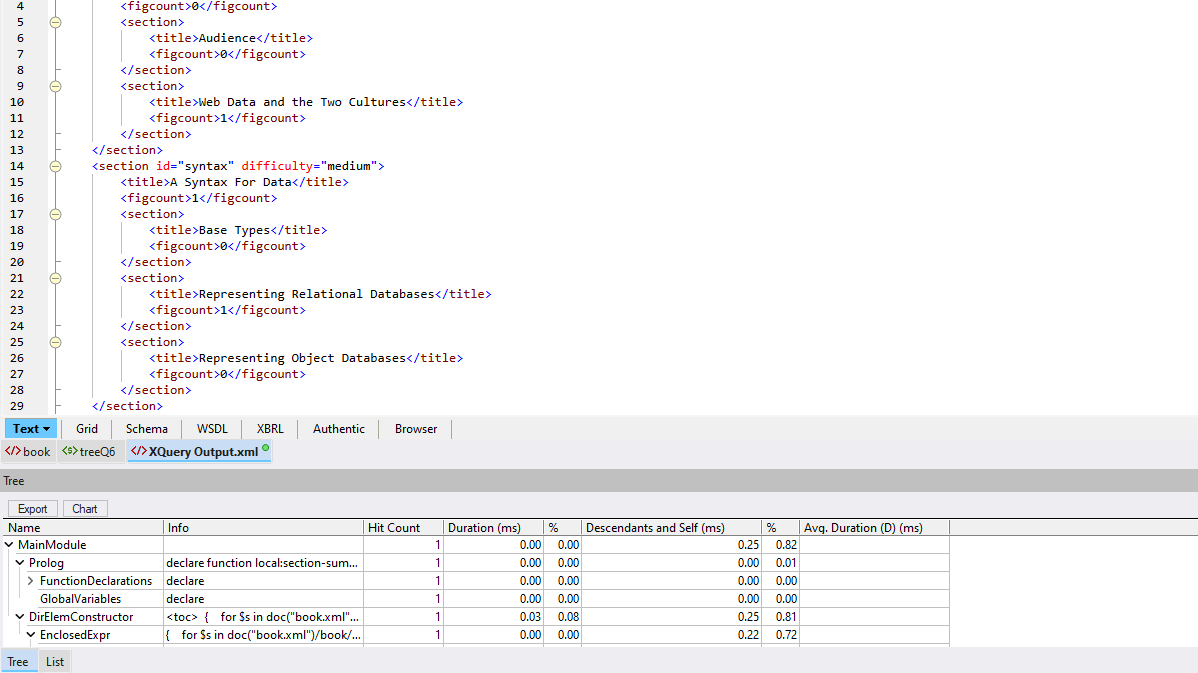
XMLSpy XQuery ProfilerAltova XMLSpy® 2012 includes a profiler for optimizing your XQuery code. In addition to its powerful XQuery debugger, XMLSpy now includes an XQuery profiler for fully optimizing your XQuery (XML Query) code. The XQuery profiler monitors and records detailed metrics for each processing instruction executed during an XQuery execution, helping you identify and eliminate bottlenecks quickly.
When you execute an XQuery in XMLSpy, the XQuery profiler displays metrics including hit count, duration, and descendants’ duration. You may expand and collapse the results and view them in a list or tree view.
Based on the information revealed by the XQuery profiler, you can immediately see which parts of your code are taking the most time to process and adjust them accordingly to optimizing your XQuery documents. Charting ResultsXMLSpy® 2012 will even generate a pie, line, bar, or gauge chart of the results, or a subset of the results, returned by the XQuery Profiler, giving you an instant, visual representation of your XQuery performance that you can save or share with other team members. As you optimize your code and profiler data changes, the chart is updated on-the-fly. ![]() See how all the XQuery development, debugging, and profiling capabilities of XMLSpy will help you create more effective XQuery documents faster than ever. Download a free 30-day trial of XMLSpy. |
| |||||||||||||||||||||||||||
| Company | Legal | Press | Partners | Careers | Sitemap | Contact Us | Altova Blog | Mobile | Full Site | |||
|
