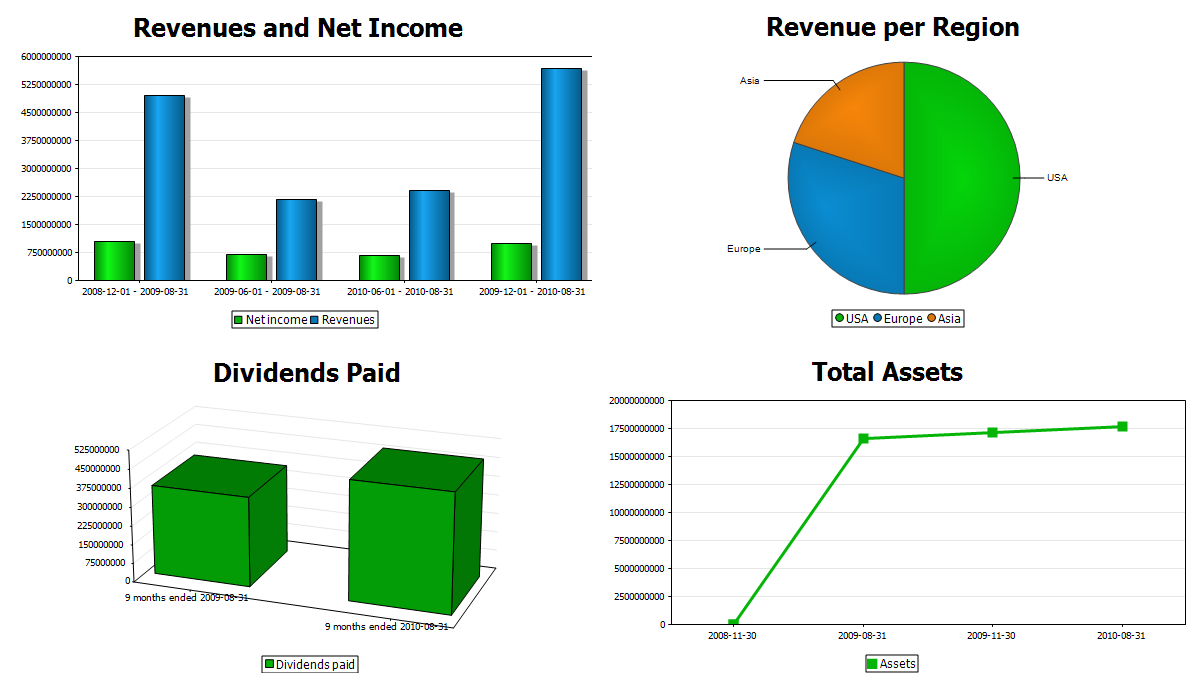
Home. 
.

transparent

transparent

transparent

Charting & Graphing

Altova StyleVision® 2012 is an intelligent reporting tool that enables designers to visualize XML, database, and/or XBRL data in charts and graphs for multi-channel output. Charts can be developed quickly for static or dynamic data and integrated into consolidated report designs.

Charting brings a new dimension to your report designs, allowing you to present data that can be easily analyzed from a variety of different angles. The addition of charting to StyleVision's already powerful general purpose reporting capabilities – including support for modular designs, conditional templates, dynamic publishing, creating electronic forms, multiple output formats, and more – makes for an advanced and highly scalable decision support tool for XML, database, and XBRL content.

chart maker

Chart Design

StyleVision charts are easily integrated into your report templates at any point by simply dragging the relevant node onto the design pane and choosing Insert Chart from the context menu. The Chart Configuration dialog can then be used for chart settings (choosing chart type and style) and data selection (populating your chart axes with the relevant data from the source).

chart configuration

Charts supported by StyleVision include different configurations of:

  • 2D & 3D pie charts
  • 2D & 3D bar charts
  • Category line graphs
  • Value line graphs
  • Gauge charts
  • Stacked bar charts
  • Area charts
  • Stacked area charts
  • Candlestick charts

and can be selected or modified by selecting the Change type option in the Chart Configuration dialog or by using the Properties entry helper window. Other basic settings (title, height, and width) can be input as strings, or by using XPath to pass information on from your source file(s).

You can also use the All settings option to define advanced settings that further define your chart type including background color, font, and more specific details such as labeling, color schema, line properties, axis position, etc. For example, the screenshot below demonstrates some of the options available for the y-axis of a value line graph.

chart appearance

StyleVision even lets you specify background color gradients and background images to create a unique appearance for your charts.

chart background image

The Change Appearance dialog lets you select a background image, as shown in the Winter Games chart above, or apply a background color gradient, as demonstrated in the Summer 2010 chart below.

chart background settings

chart background settings

Dynamic XPath Settings

Dynamic XPath settings let you apply dynamic data from an XML document to the settings of your chart.

dynamic xpath settings

For example, if you have a chart that shows regional data, you may wish to reflect the name of each region in the title of your chart. If there are several Region elements, then the data for the chart title can be selected dynamically via an XPath expression depending on which set of data is being presented in the chart.

dynamic xpath settings

Chart Data Selection

Chart data is selected using XPath expressions to locate nodes in the source data. StyleVision offers two different options for selecting data for your chart:

Simple Data Selection

The Simple data selection option lets you to select chart data as a table using XPath for-each expressions to access nodes.

simple data selection

The screenshot above shows an example where data is being evaluated with respect to the Region[1]/Year context node. The first iteration returns six y-axis values (rows), one for each id attribute, to create the first series, "Americas". The next two y-axis expressions return the same data for their respective series ("Europe" and "Asia"), giving us the chart output shown below.

simple chart

Flexible Data Selection

While the simple data selection covers about 85-90% of all cases where you want to create a chart, there are those situations where the data series are either distributed over several places in your XML documents, or – even more difficult – where you have disjoint sets of category values or maybe category values that have little overlap. In those cases, the flexible data selection give you the extra power to specifically point to the location of the data for your categories and values via powerful XPath selectors.

The Chart Data Selector section of the Chart Configuration dialog offers four different fields for specifying Flexible chart data.

  • For-each - the context node for your chart data (if at a different level than that originally chosen for your chart design)
  • Series name - this enables you to define series (or a z-axis) for your bar charts and line graphs
  • Category/X-Axis - the horizontal data in a standard graph, this field is used to specify the category of the data that is being reported
  • Value/Y-Axis - the vertical data in a standard graph, this field is used to specify the value of the data being reported

You can type your XPath statements directly into the Chart Configuration dialog or use StyleVision's built-in XPath Builder for assistance with more complex expressions.

flexible data selection

The screenshot above shows data selection for a simple bar chart that returns two different sets of data. One set shows temperature for the hottest months, while the other reports on rainfall for the rainiest months. Flexible data selection lets us easily show both of these data sets on the same graph using different XPath expressions to select each node, even though they have very little overlap between the category values.

flexible chart

Chart Overlays

Chart overlays enable you to combine multiple charts in a single image. Each overlay chart has unique settings and can even be generated from a separate data file. For example, the chart below shows a candlestick chart for opening, high, low, and closing share prices with a bar chart overlay for the daily share volume.

chart overlay

Interactive Charts

StyleVision charting can be used to create interactive electronic forms for use with Authentic®, Altova's low cost WYSIWYG content editor. Using advanced features like conditional templates, editable variables, and XPath predicates lets you create forms that can be manipulated by Authentic end-users for the desired result. For example, the screenshot below shows the Authentic view of a pie chart where drop-down menu (combo box) selection dictates the subset of data that is represented in the chart.

dynamic chart

XBRL Chart Wizard

Because of the complexities of XBRL taxonomies and the data contained in XBRL reports, Altova has developed an XBRL Chart Wizard. For information on this, and other XBRL reporting functionality in StyleVision, visit the XBRL Rendering page.


Check out charting support in StyleVision for powerful and flexible visual reporting. Download a free 30-day trial of StyleVision.


transparent
Download
Pricelist
Buy
Video
Online Training
Comparison
Datasheet
Print
Mail
Like It
.

64-bit report builder

.

StyleVision is available in 32-bit and 64-bit versions. Learn about the advantages of choosing the 64-bit report builder when you have a 64-bit operating system.

.
.
.

transparent

transparent