To complement its database mapping and integration capabilities, MapForce includes a Database Query tab for performing direct database queries. When you connect to a database using the Database Query tab, MapForce displays its tables in a hierarchical tree in the browser pane.
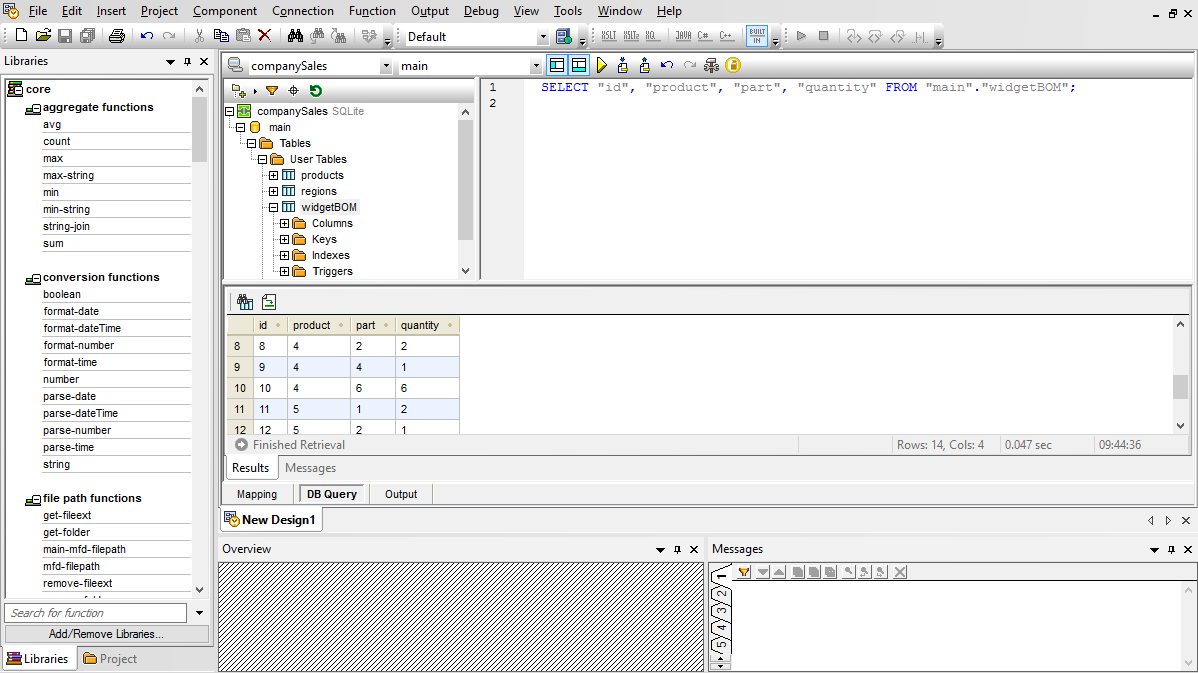
You can then use the SQL editor tab to display, edit, and execute SQL or SQL/XML statements, either by opening existing SQL files or creating SQL statements from scratch using drag and drop and auto-complete functionality.
You can execute your SQL script and view the results in tabular form and save both the retrieved data and the SQL script individually to separate files.
The MapForce database key settings allow you to customize how primary and foreign key values will be added to a database that is a data mapping target. You can either provide values for keys from within MapForce, or you can let the database system handle the generation of auto-values.
In situations where primary and/or foreign key relationships are not explicitly defined in your database tables, MapForce allows you to define these relationships inline, without any effect on the source data.
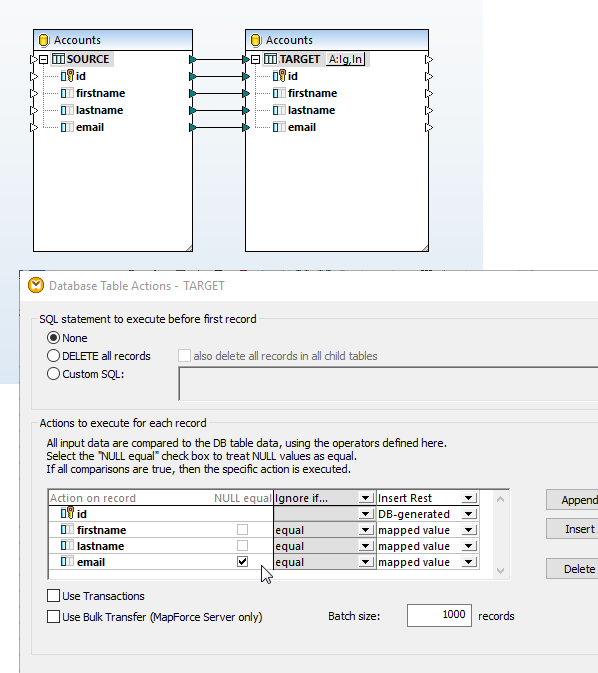
When you are mapping to a database, MapForce allows you to select database table actions to control how data is written to the database. This gives you full flexibility to automate the most advanced data management tasks.
The easy-to-use Database Table Actions dialog box allows you to define the columns within the selected table to be used to determine what action (INSERT, UPDATE, DELETE) should be executed in the database.
This provides unprecedented flexibility in manipulating database rows in response to XML, PDF, database, EDI, XBRL, flat file, Excel, JSON, JSON5, Protocol Buffers, Web services, or other database data through MapForce.
MapForce includes robust support for stored procedures as input components (procedures that provide results) or as output components (procedures that insert or update data). Or, stored procedures may be inserted as a function-like call allowing users to provide input data, execute the stored procedure, and read/map the output data to other components.
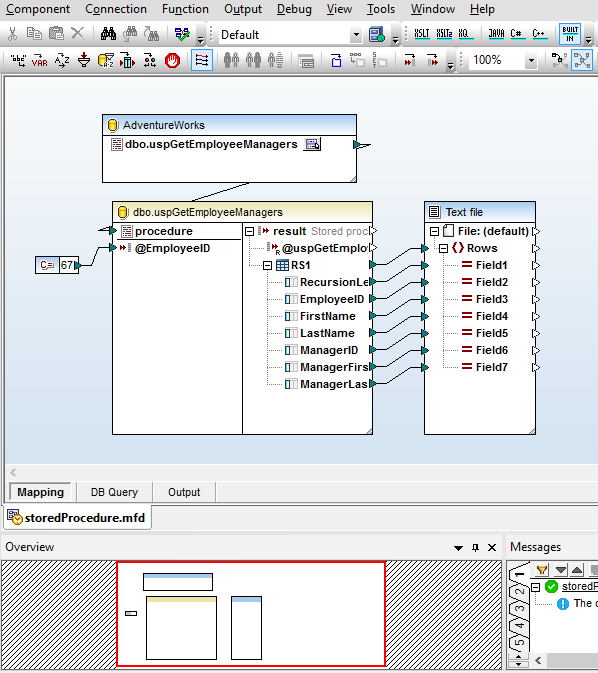
This screenshot shows the mapping of a stored procedure in SQL Server to create an XML file. The procedure returns a table of data showing all the managers in the chain of command above the specified employee ID, supplied as an input parameter – in this example the constant 67.
The parameter could also be supplied as a calculated value or a data element retrieved from elsewhere in the database.
MapForce provides a context menu that lets users run the stored procedure to reveal the data structure for mapping. Executing the illustrated mapping generates the XML output.
In addition to extensive XML mapping functionality, MapForce also allows you to connect to and map XML data stored in relational database fields (currently supported for SQL Server & IBM DB2). You simply assign an XML Schema – either one registered in the database or one from your local file system – to the field, and MapForce renders the schema as a sub-tree of the database field for mapping purposes.
SQL queries that operate inside the database are not always sufficient for complex data mapping tasks. MapForce provides additional database sorting functionality through the SQL-WHERE/ORDER component for database input that requires additional processing, or when other data or conditions in the mapping impact the sorted order of data rows.
The Database Table Actions dialog supports NULL value comparison. NULL-aware comparisons provide an improved way to handle databases that contains null values. MapForce users can configure a database mapping so that data comparison is done in a NULL-aware manner, according to rules applicable to the database kind involved in the mapping.
The data mapping shown at right is intended to update the target table without inserting duplicate entries. Both tables are defined allowing the email field to be NULL, so matching name entries with NULL email fields could exist in each table.
Clicking the Actions icon next to the TARGET database table opens the Database Actions Dialog. The NULL equal checkbox next to the email field allows MapForce to treat NULL values in the source and target as equal for data mapping purposes, even though they are not considered equal by database rules.